PROJECT OVERVIEW
PROJECT SCOPE
Client: Coca-Cola HBC
Role: UX Lead
Project type: UX Research & Customer Portal Experience Optimization
Deliverables: Personas, Surveys, Interviews, Search Intent Analysis, Customer Journey Mapping, UX & CX KPI Dashboards, Recommendations
Tools: Google Analytics, Microsoft Forms, WordLift AI, Custom Dashboards, Affinity Diagrams, Adobe XD
Period: Jul – Nov 2022
STORY
Coca-Cola HBC Coca-Cola HBC, one of the leading beverage suppliers, launched the Customer Portal to support B2B clients.
In a competitive market where many players offer online services, the user experience is the true differentiator.
The goal of this research was to understand how customers perceive and interact with the portal in real use, uncovering pain points, needs, and opportunities to improve the overall journey, increase engagement, and drive conversion.
UX Approach
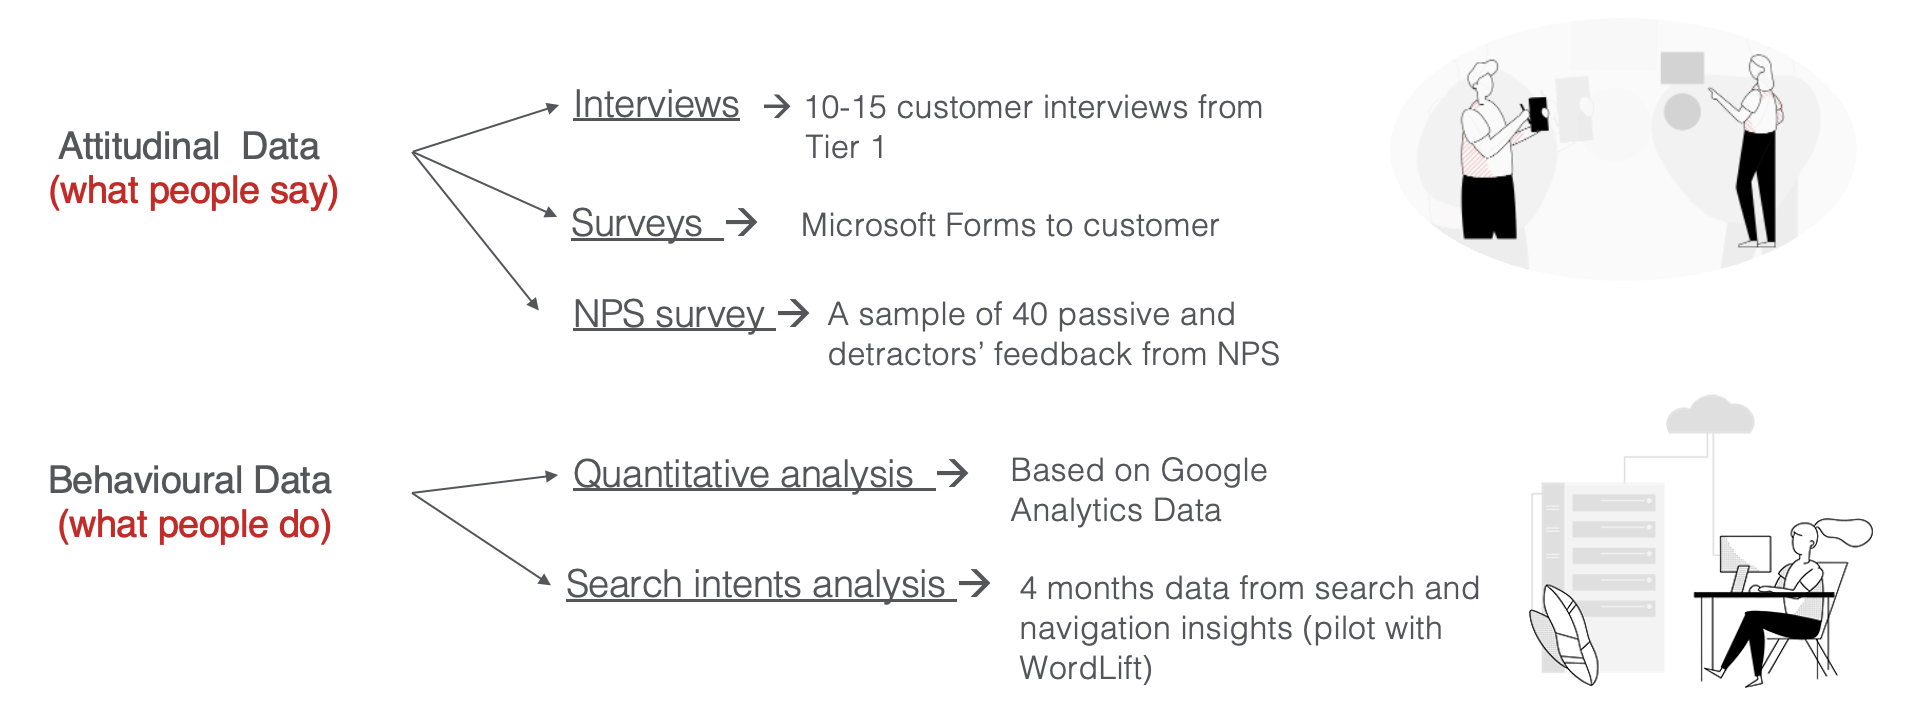
We applied a Customer-Centric Research Approach, combining behavioral and attitudinal data:
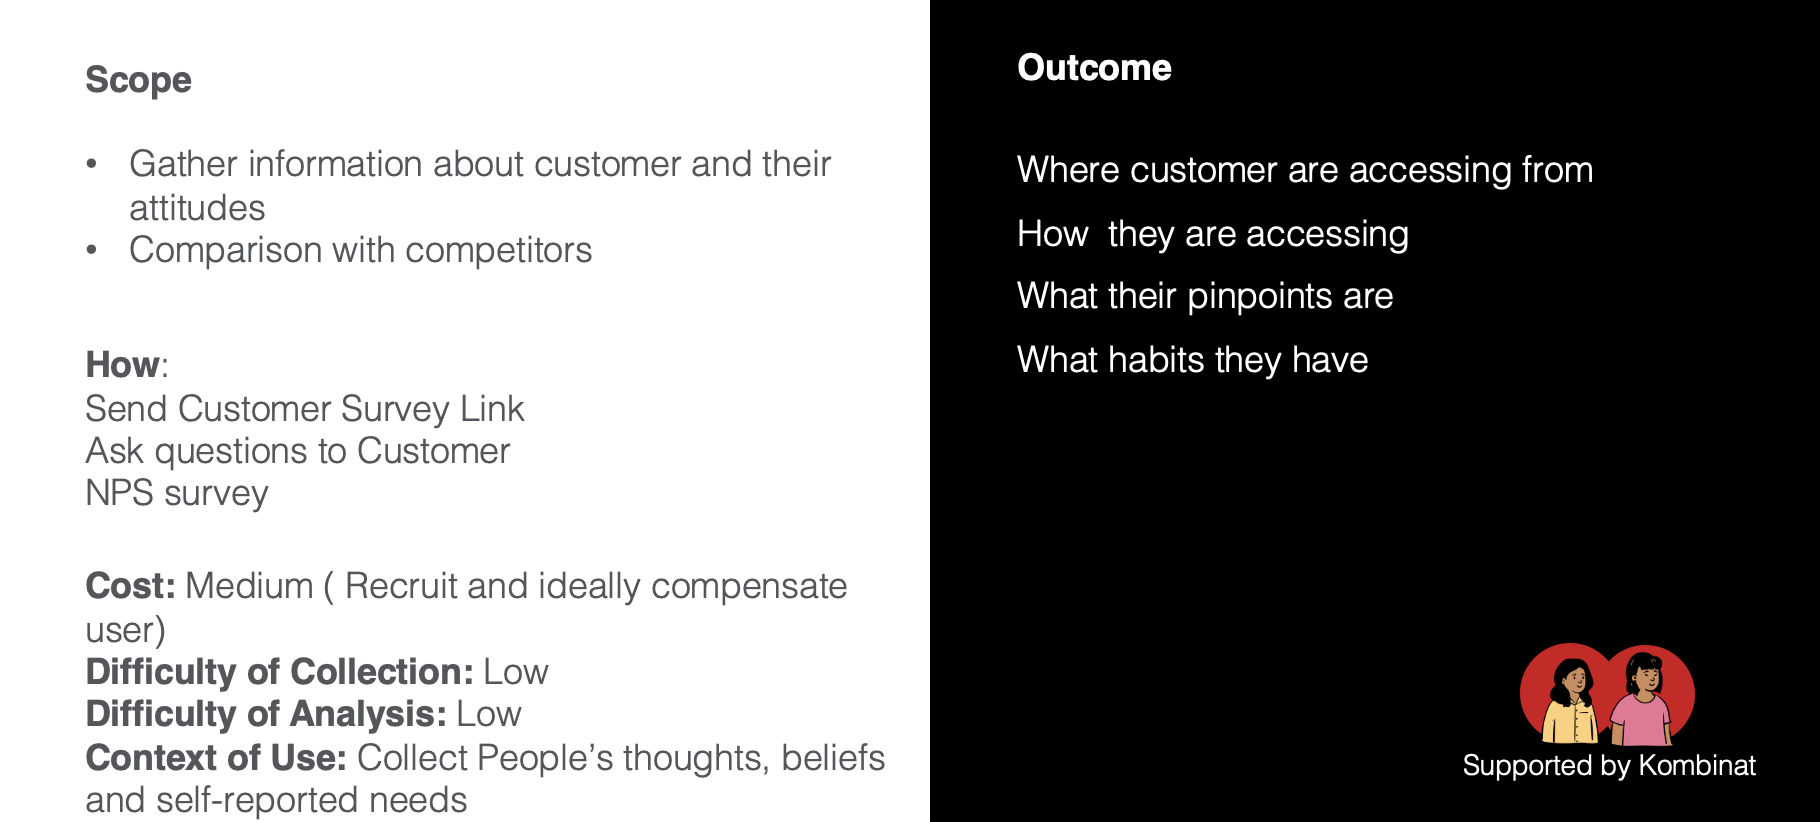
Surveys & Interviews → to capture direct feedback, habits, and expectations.
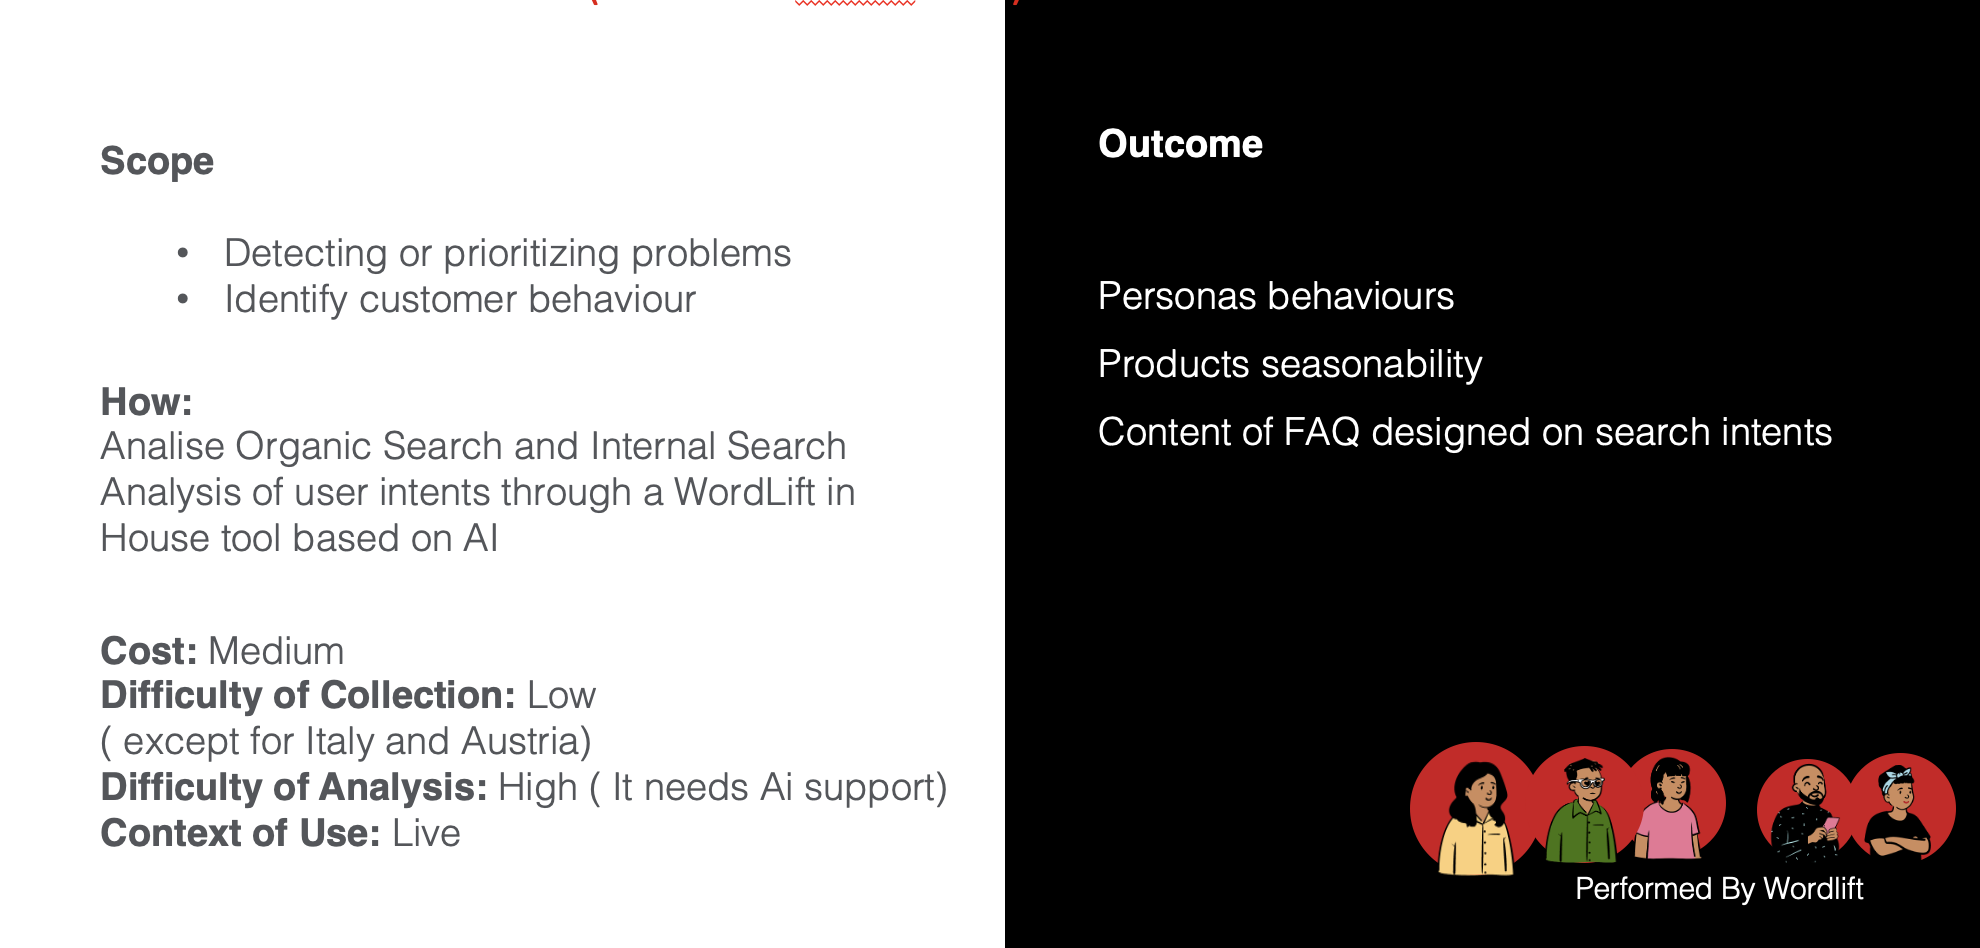
Search Intent Analysis → to uncover hidden needs and define relevant content.
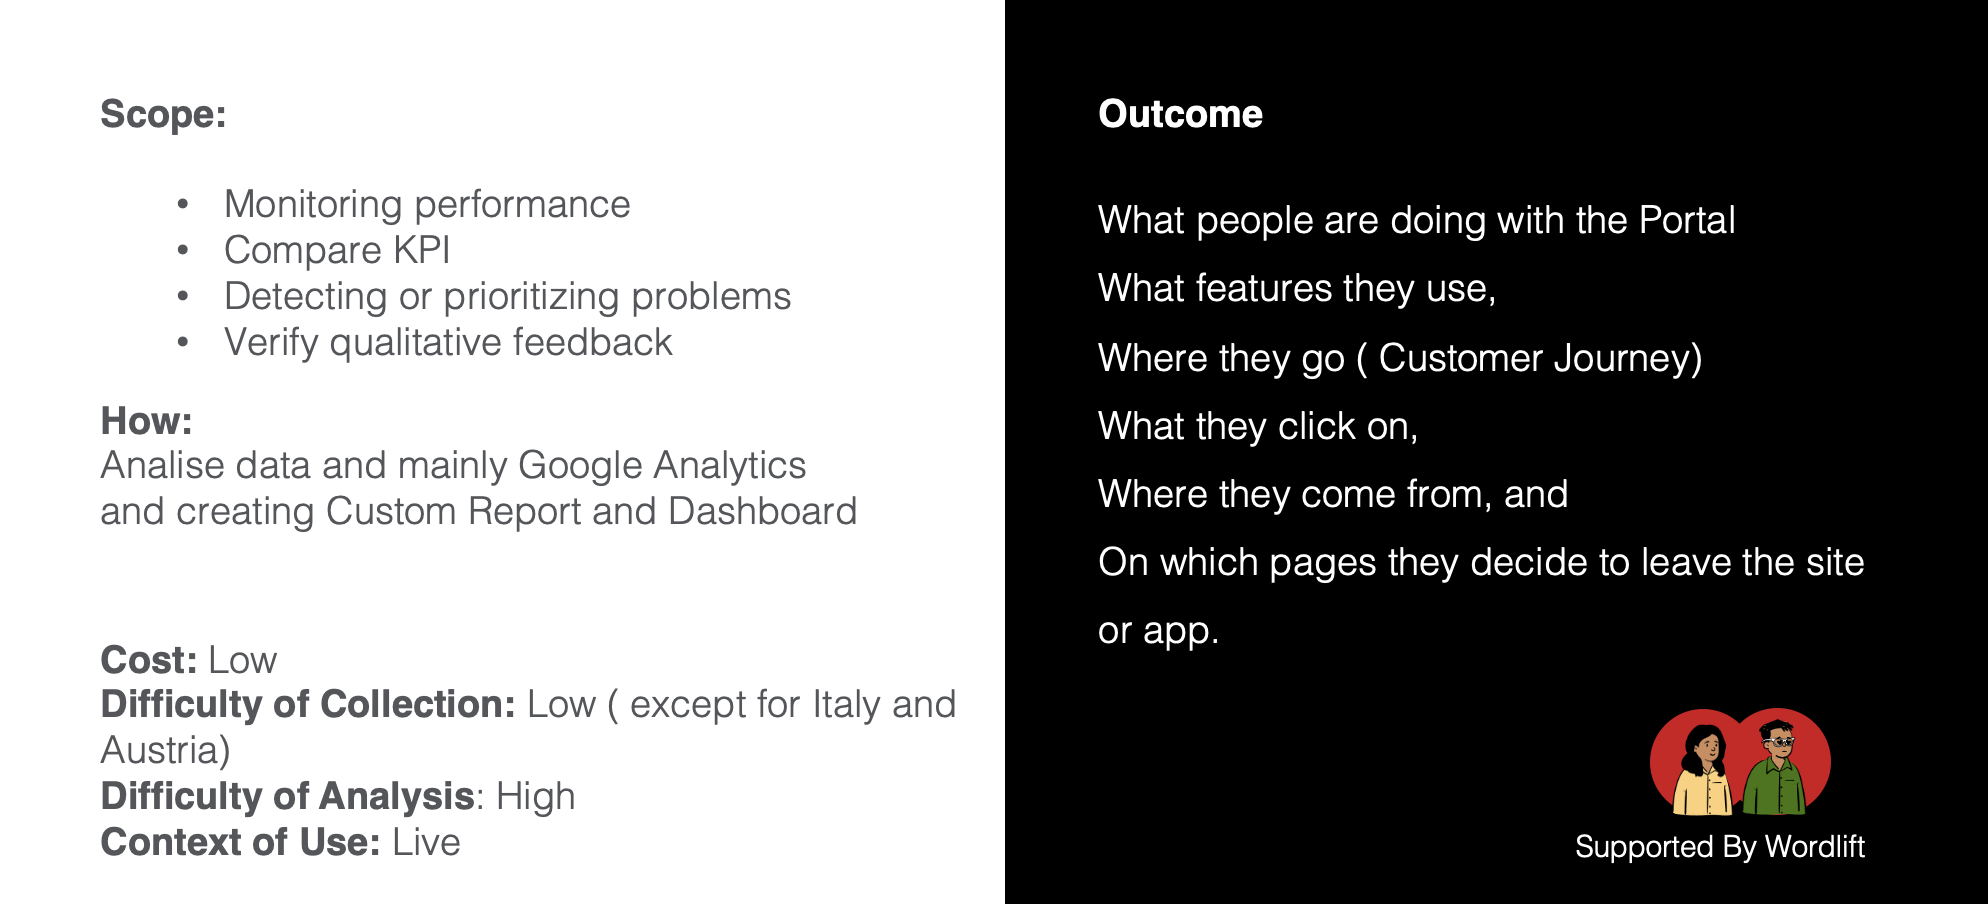
Quantitative Analytics → to track KPIs, behaviors, funnel interactions, and drop-offs.
End-to-end UX research revealed customer pain points and behaviors, turning insights into actionable improvements that enhanced engagement and streamlined the B2B journey
Approach Overview
QUESTIONNAIRE AND SURVEY
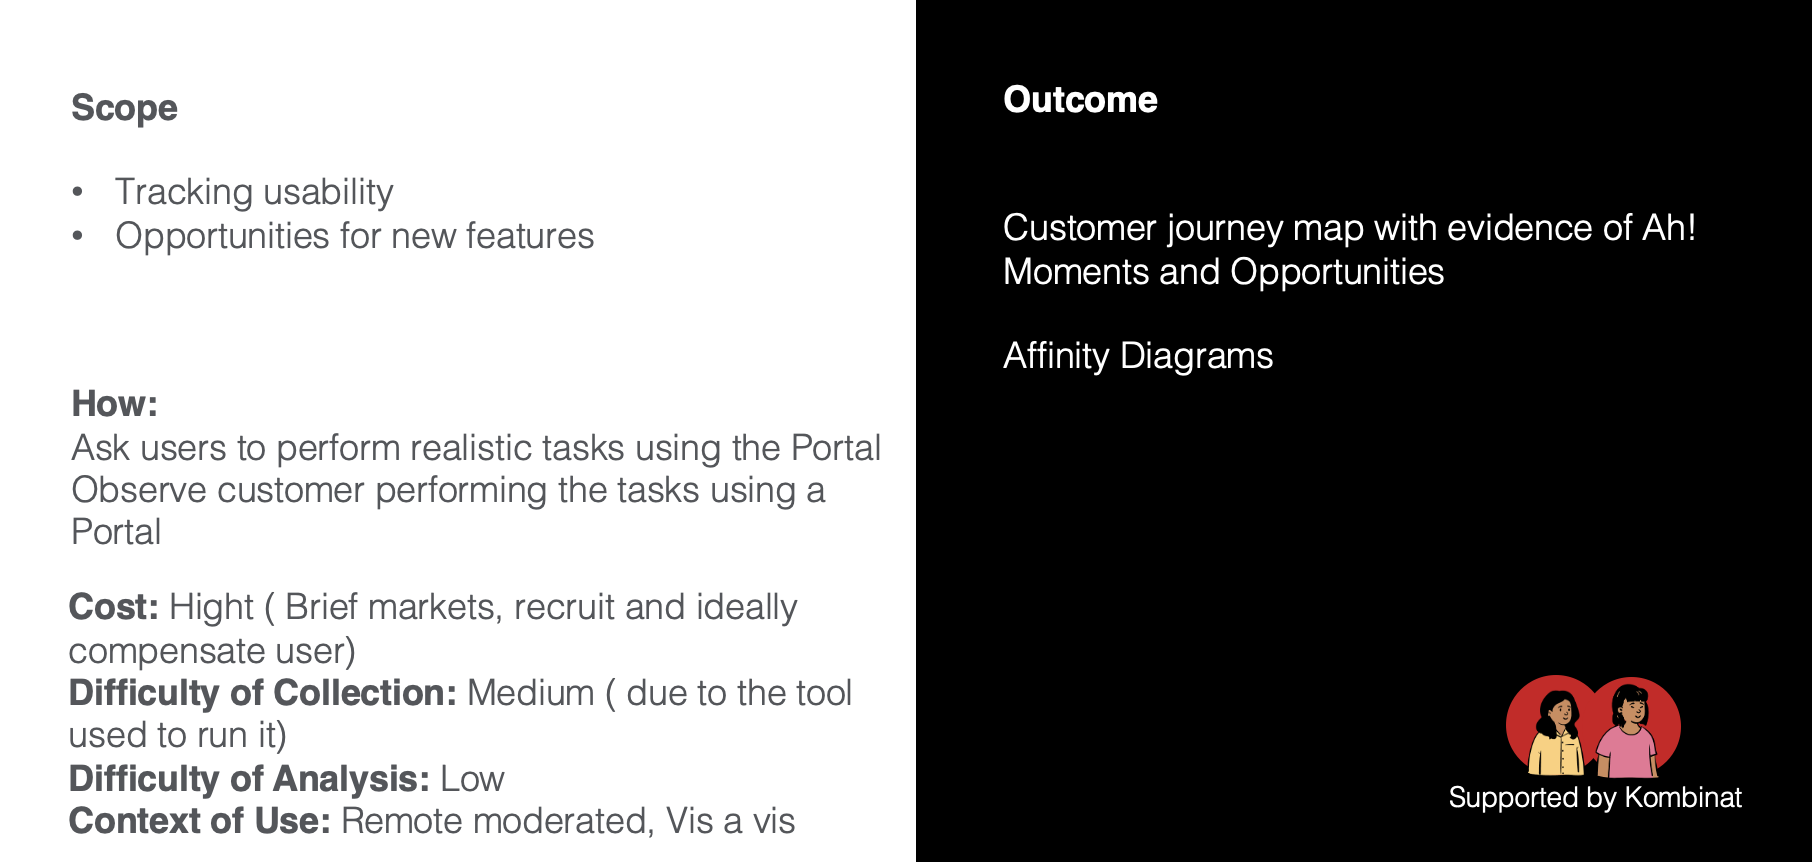
INTERVIEW (CONTEXTUAL)
QUANTITATIVE ANALYSIS
SEARCH INTENT ANALYSIS
ROLE
Acted as UX Lead, defining and executing the research strategy
Conducted surveys, interviews, analytics, and search intent analysis
Created personas, journeys, and KPI dashboards to inform design
Managed external vendors for online behavior research and interview formalization
Delivered actionable UX recommendations and prioritized improvements
Outcome
The research outcomes delivered a comprehensive view of how customers use and perceive the portal, translating insights into actionable improvements:
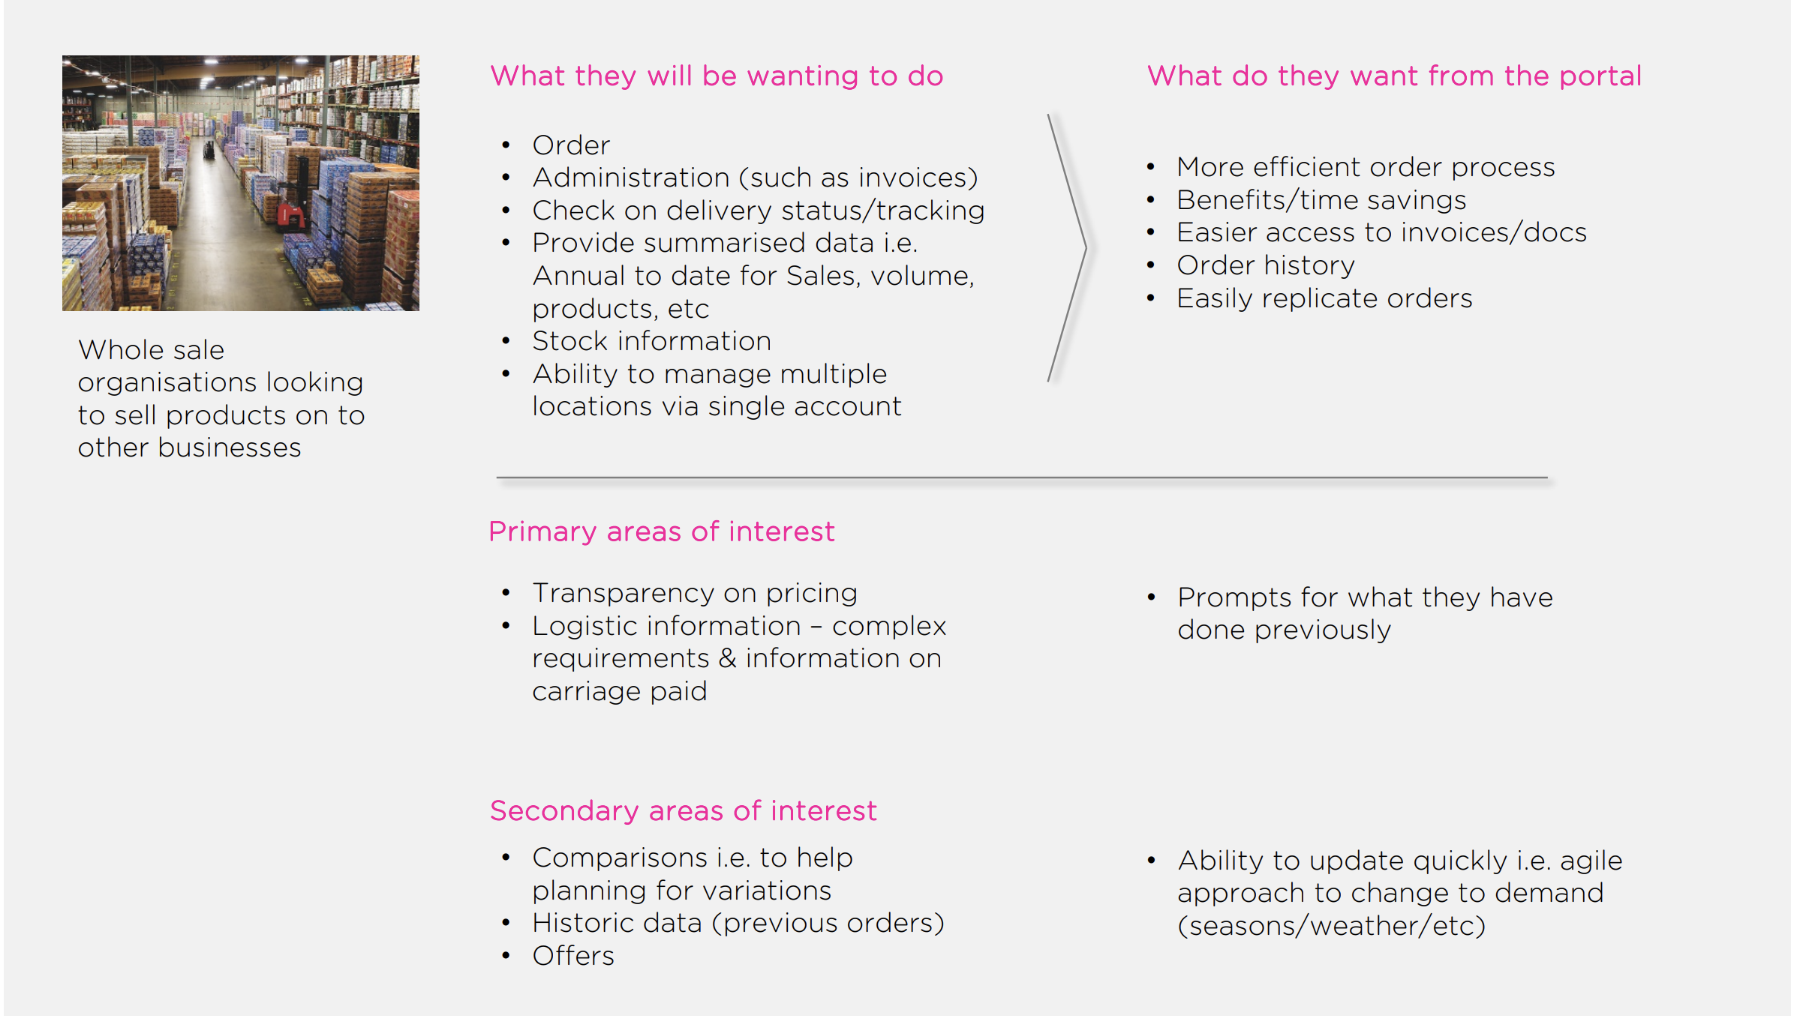
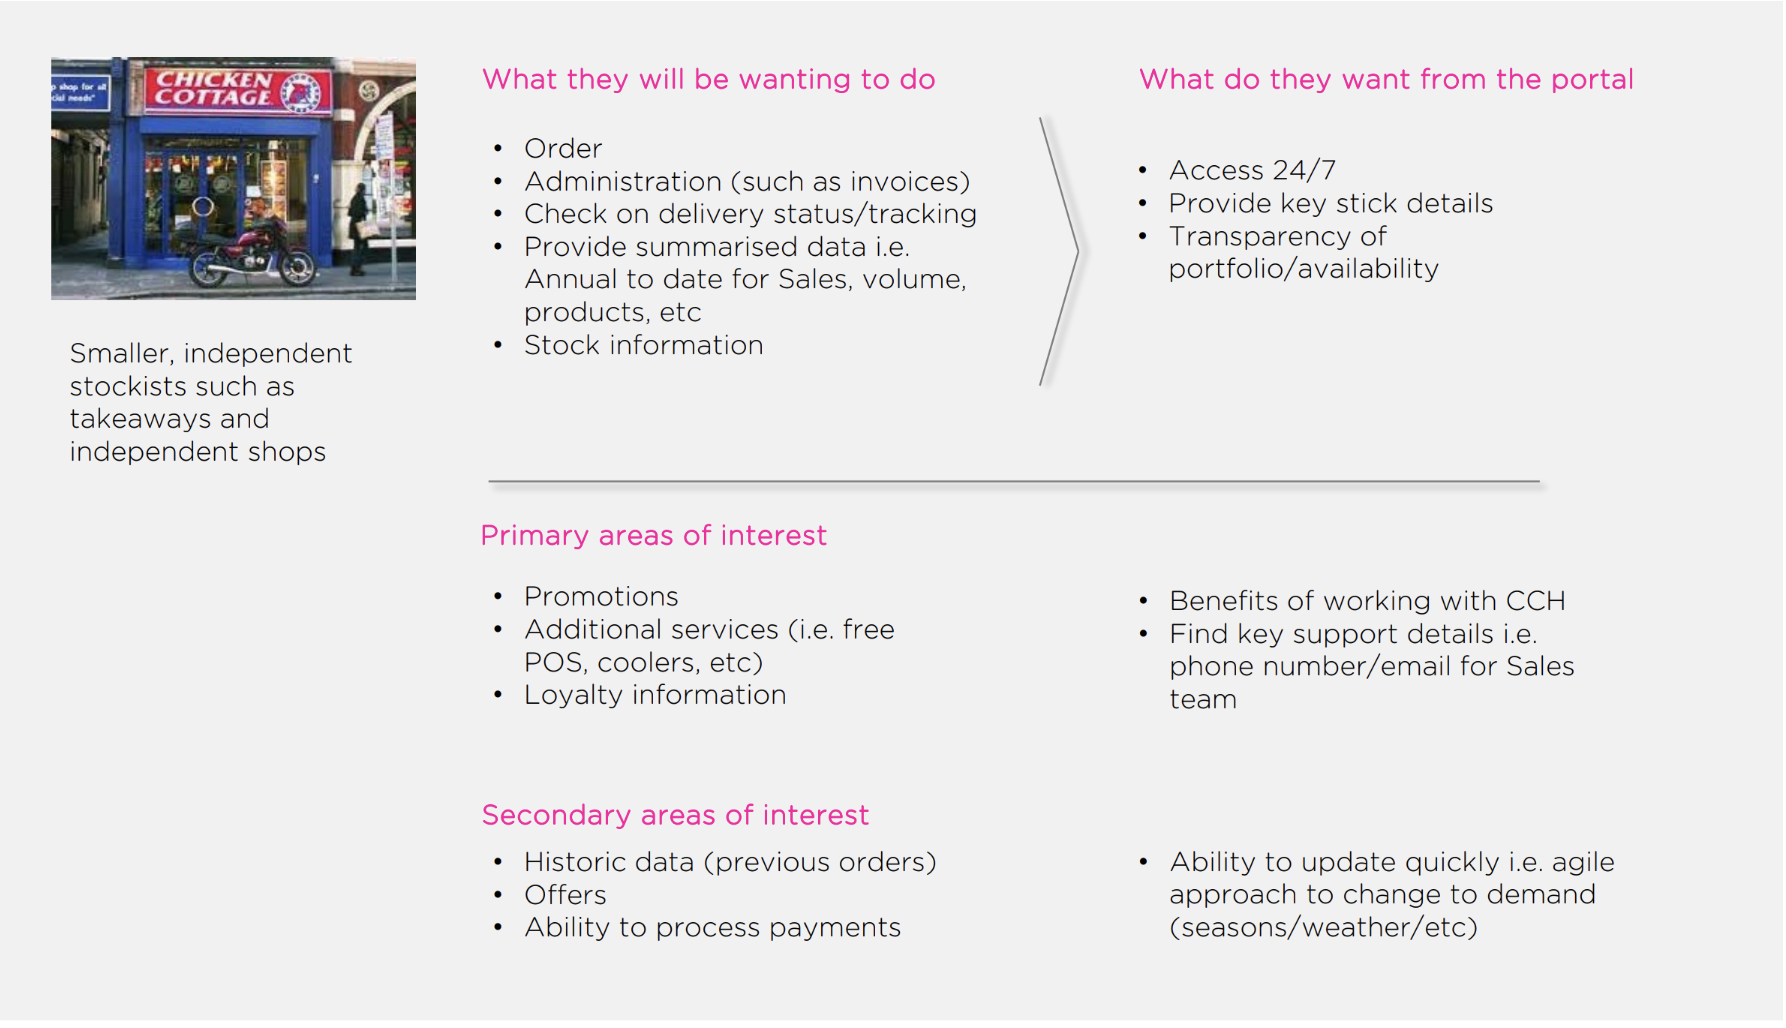
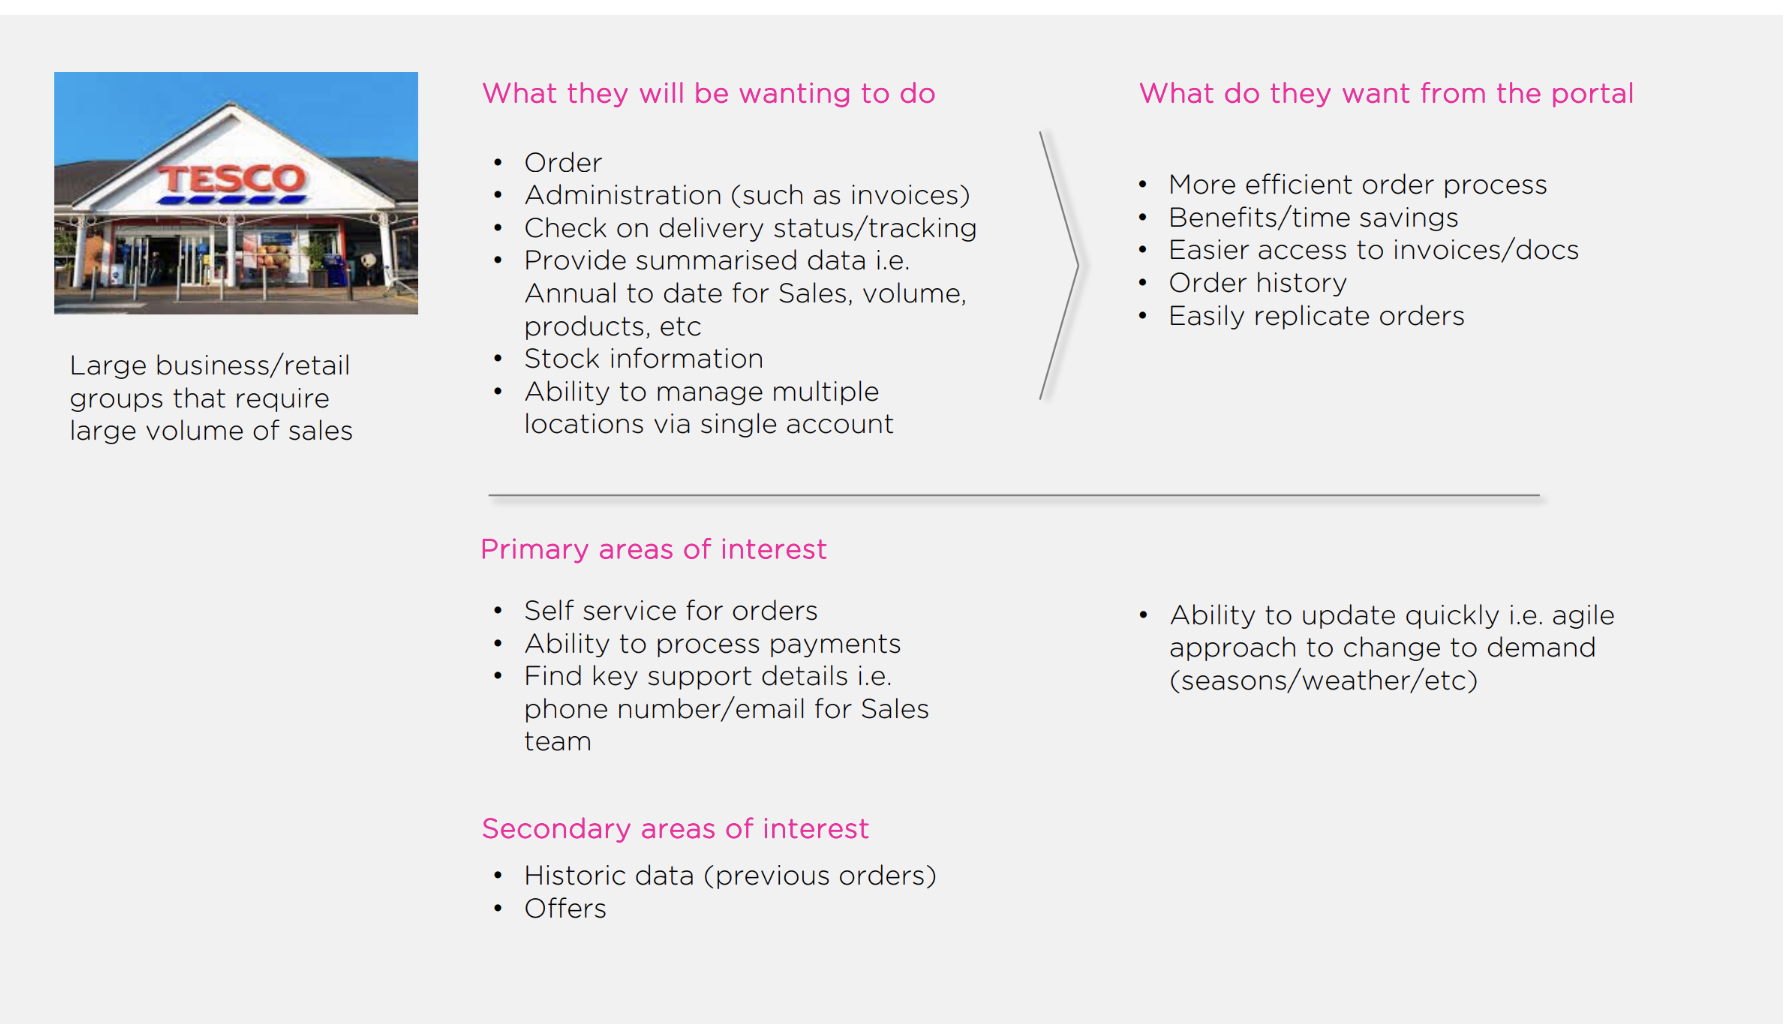
Personas → three representative clusters (Big Buyer, Medium Buyer, Small Buyer) to guide feature prioritization
Search Intents → AI-driven analysis produced multilingual FAQ content (3 languages) integrated into the portal
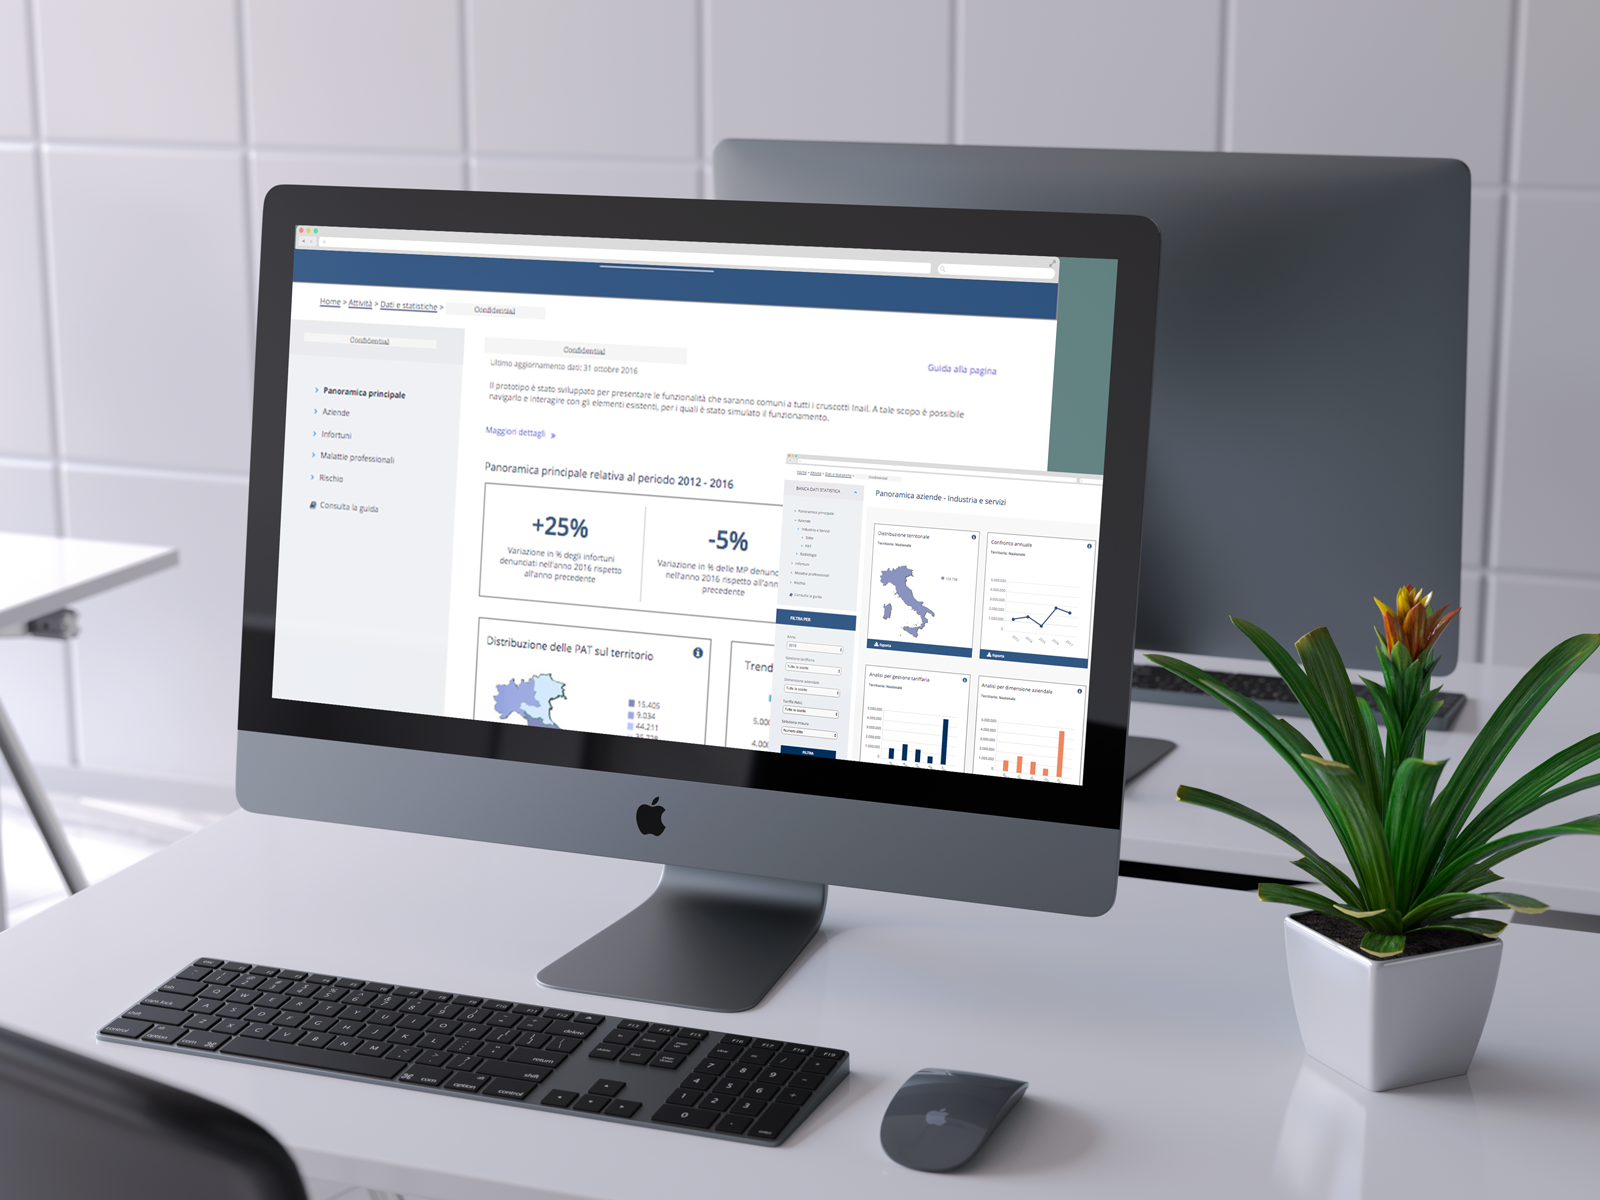
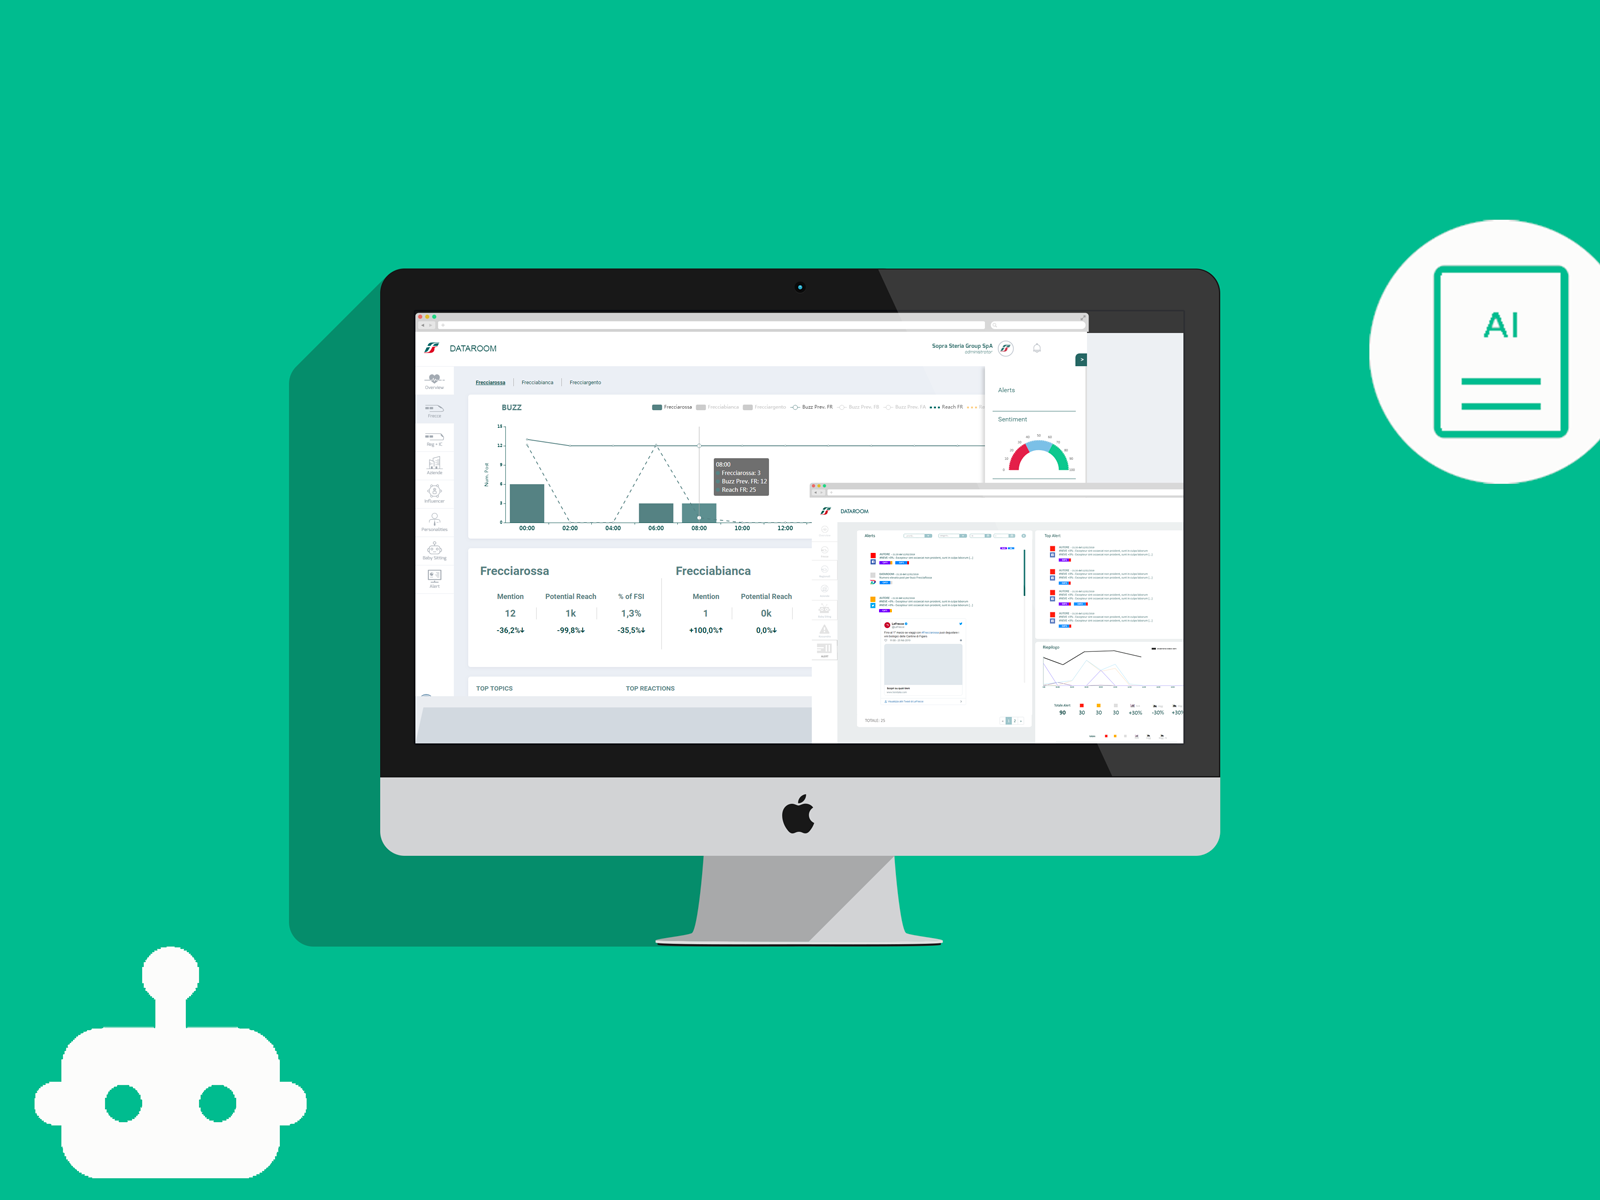
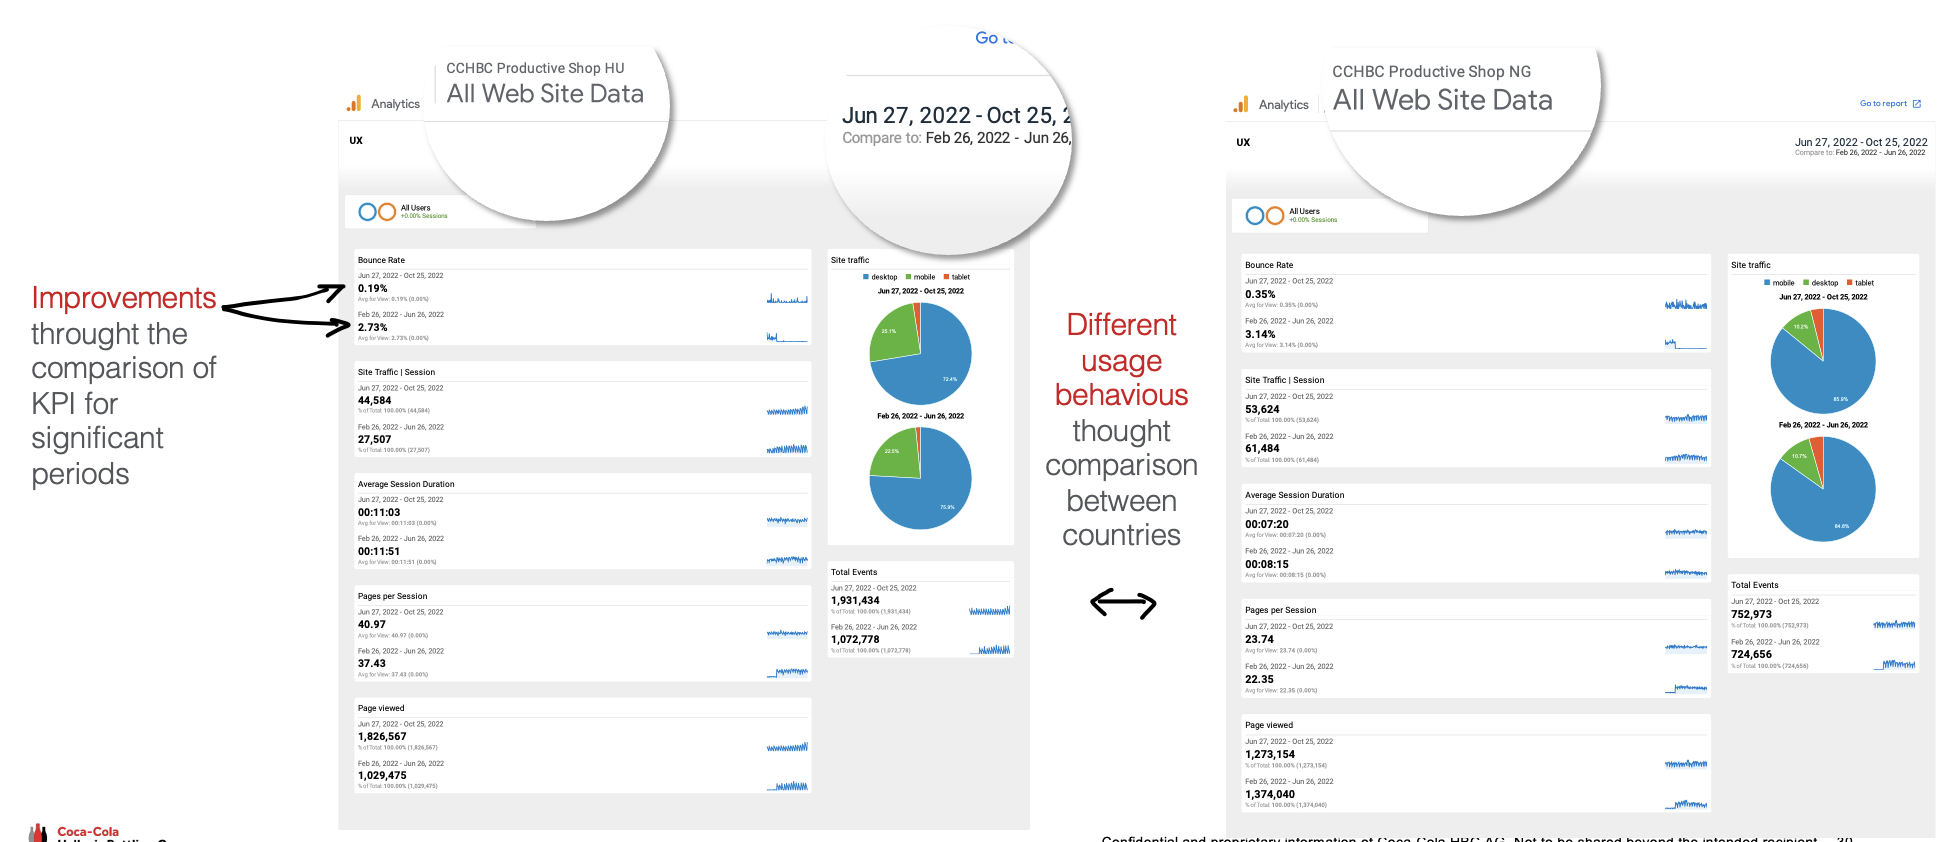
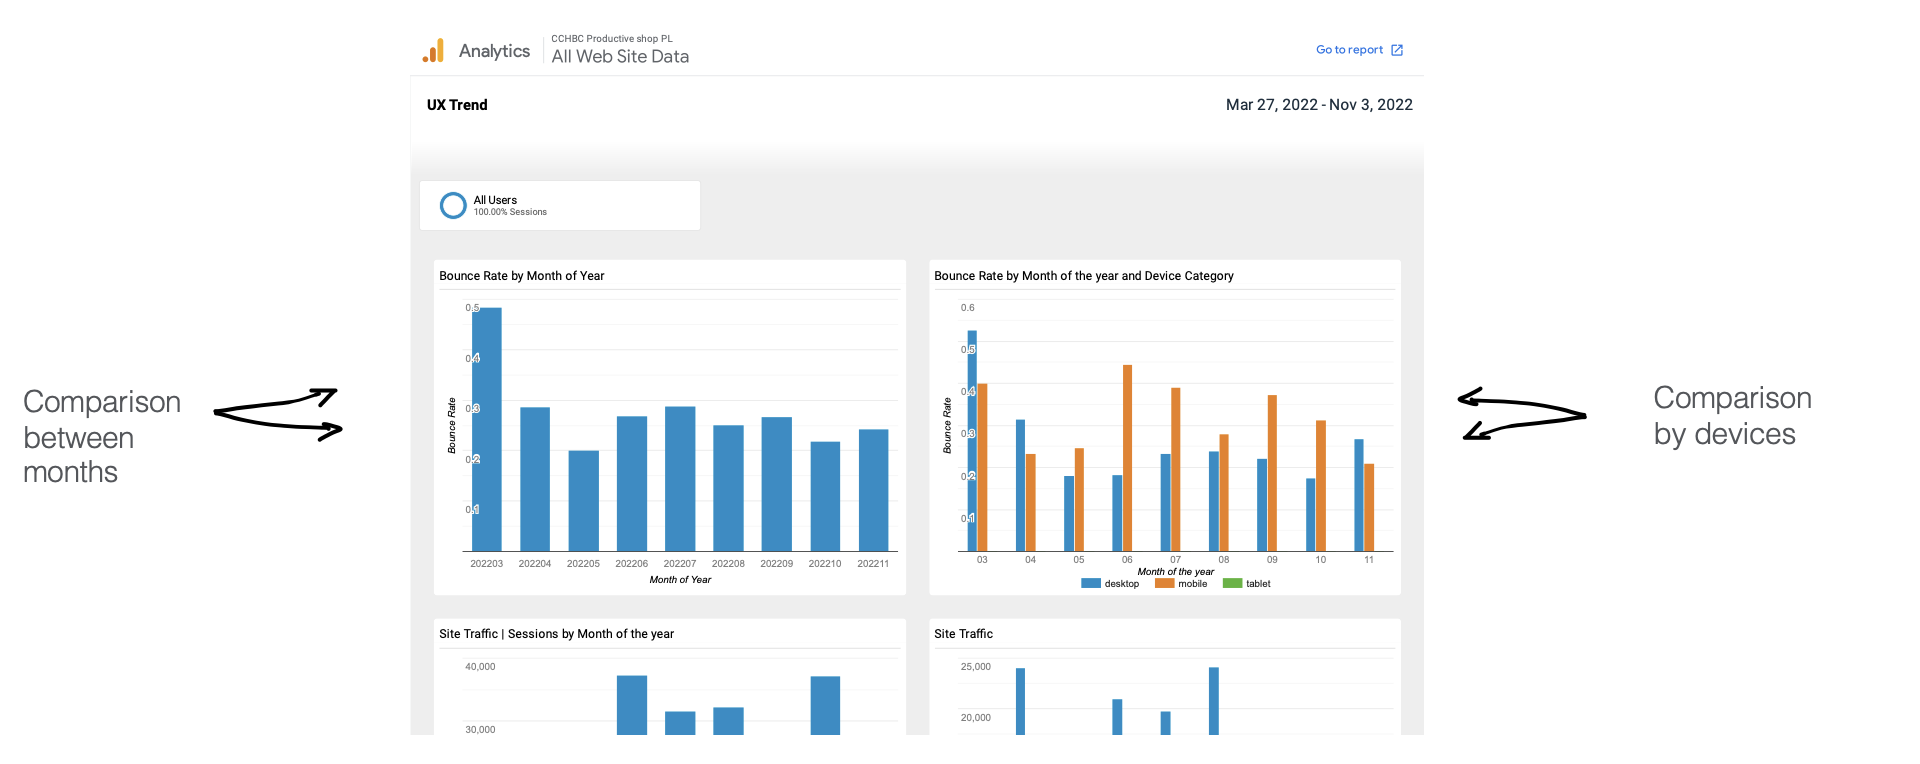
Quantitative KPIs → custom dashboards enabling comparisons across countries, devices, and periods
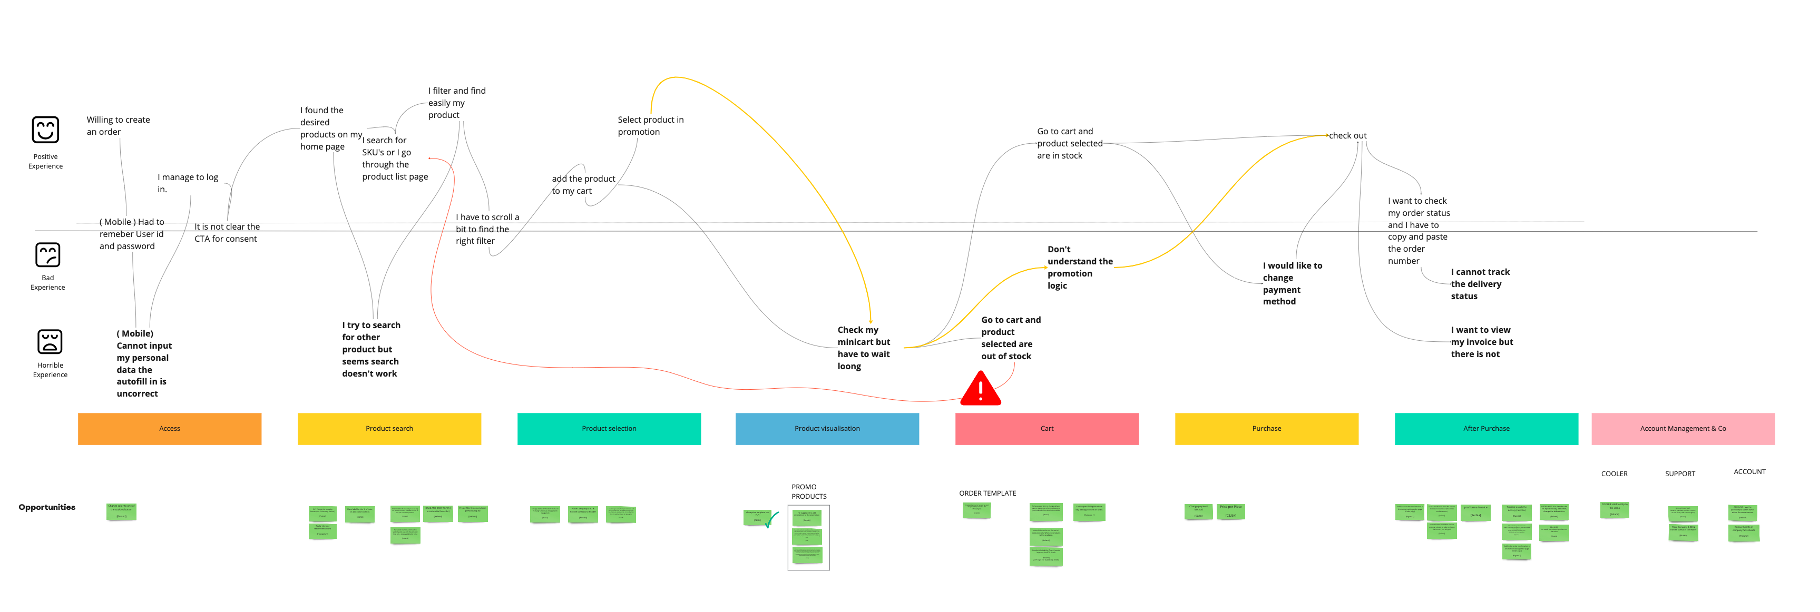
Customer Journey → mapped critical moments and “Ah!” opportunities highlighting pain points and improvement areas
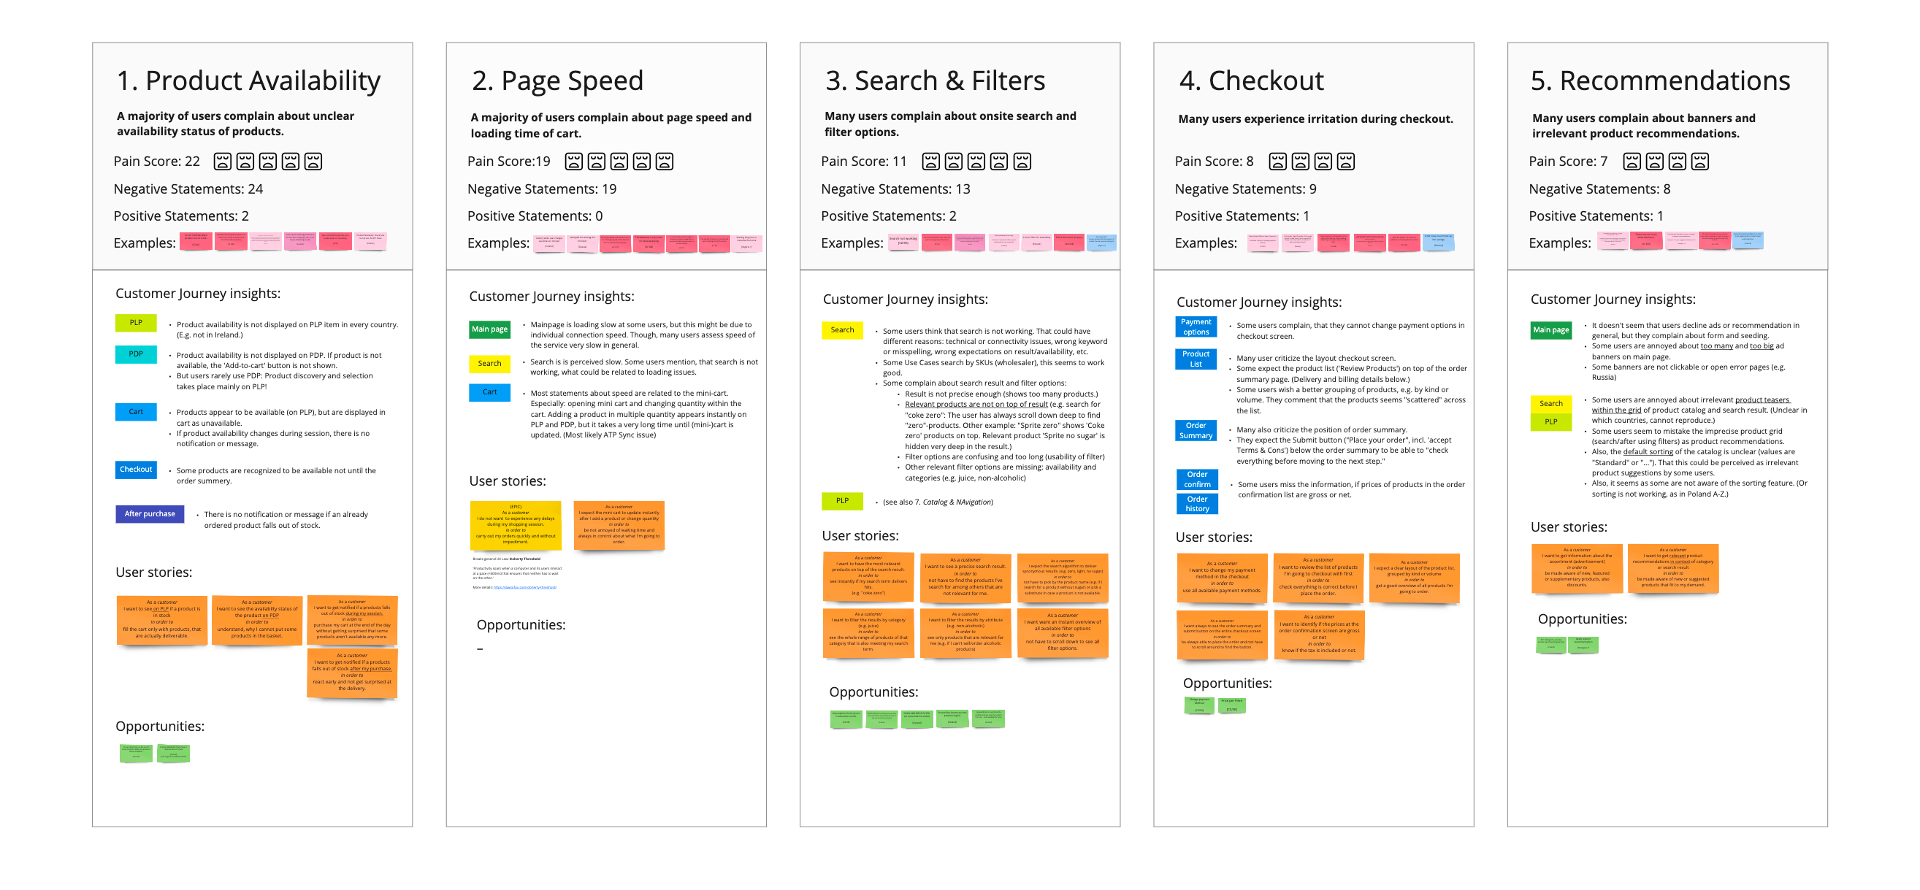
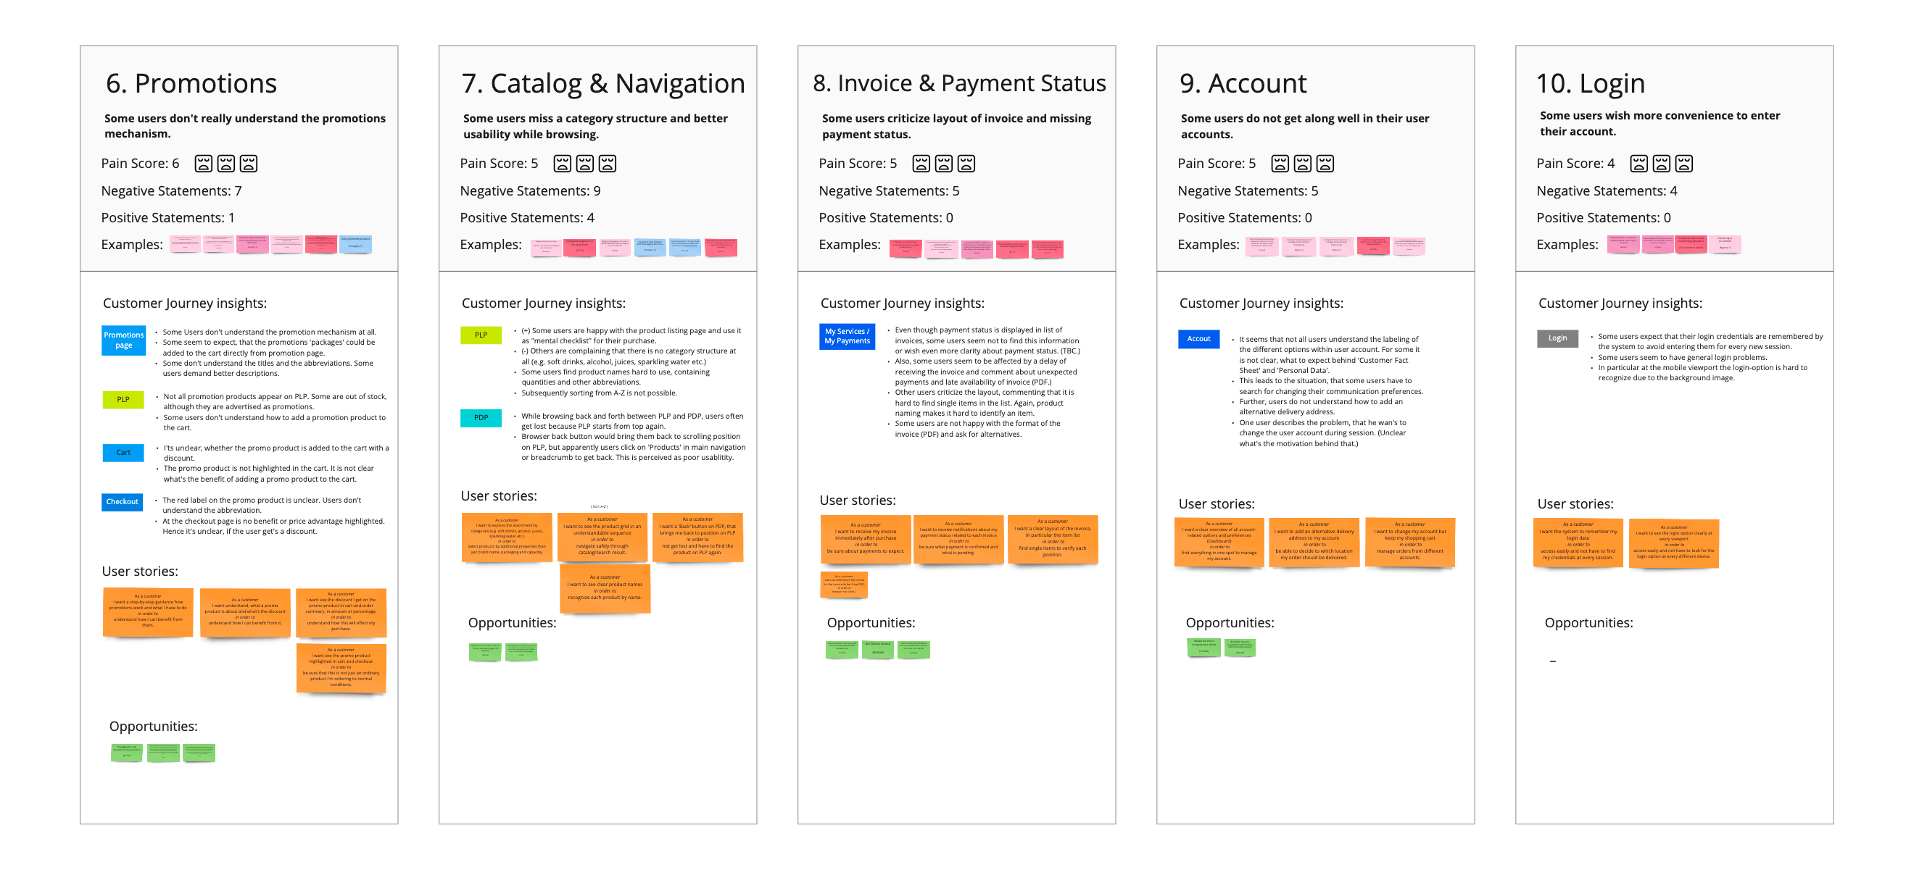
Qualitative Insights → Pain points prioritized with a “pain score” system and opportunities for new features identified
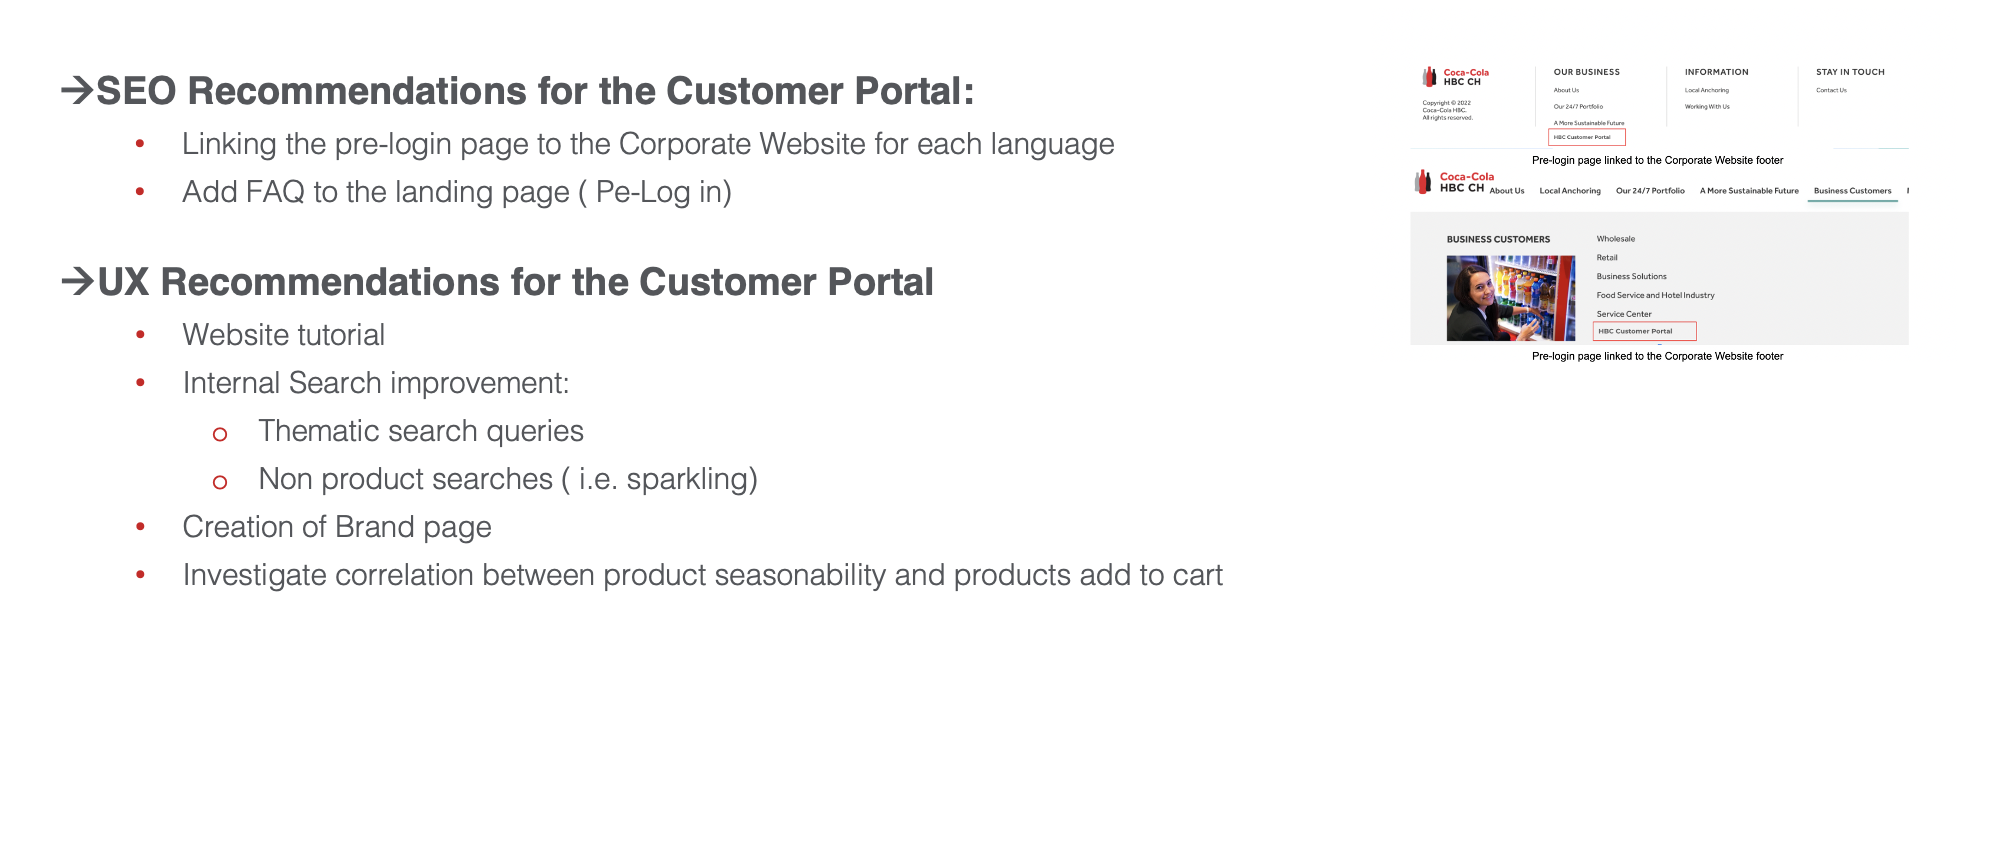
UX Recommendations → improvements to Search, Checkout flows, FAQ content, and portal performance
Strategic Actions → introduced performance testing, UI bug hunting, and a roadmap toward an omnichannel approach
Personas
Big Buyer, Medium Buyer and Small Buyer
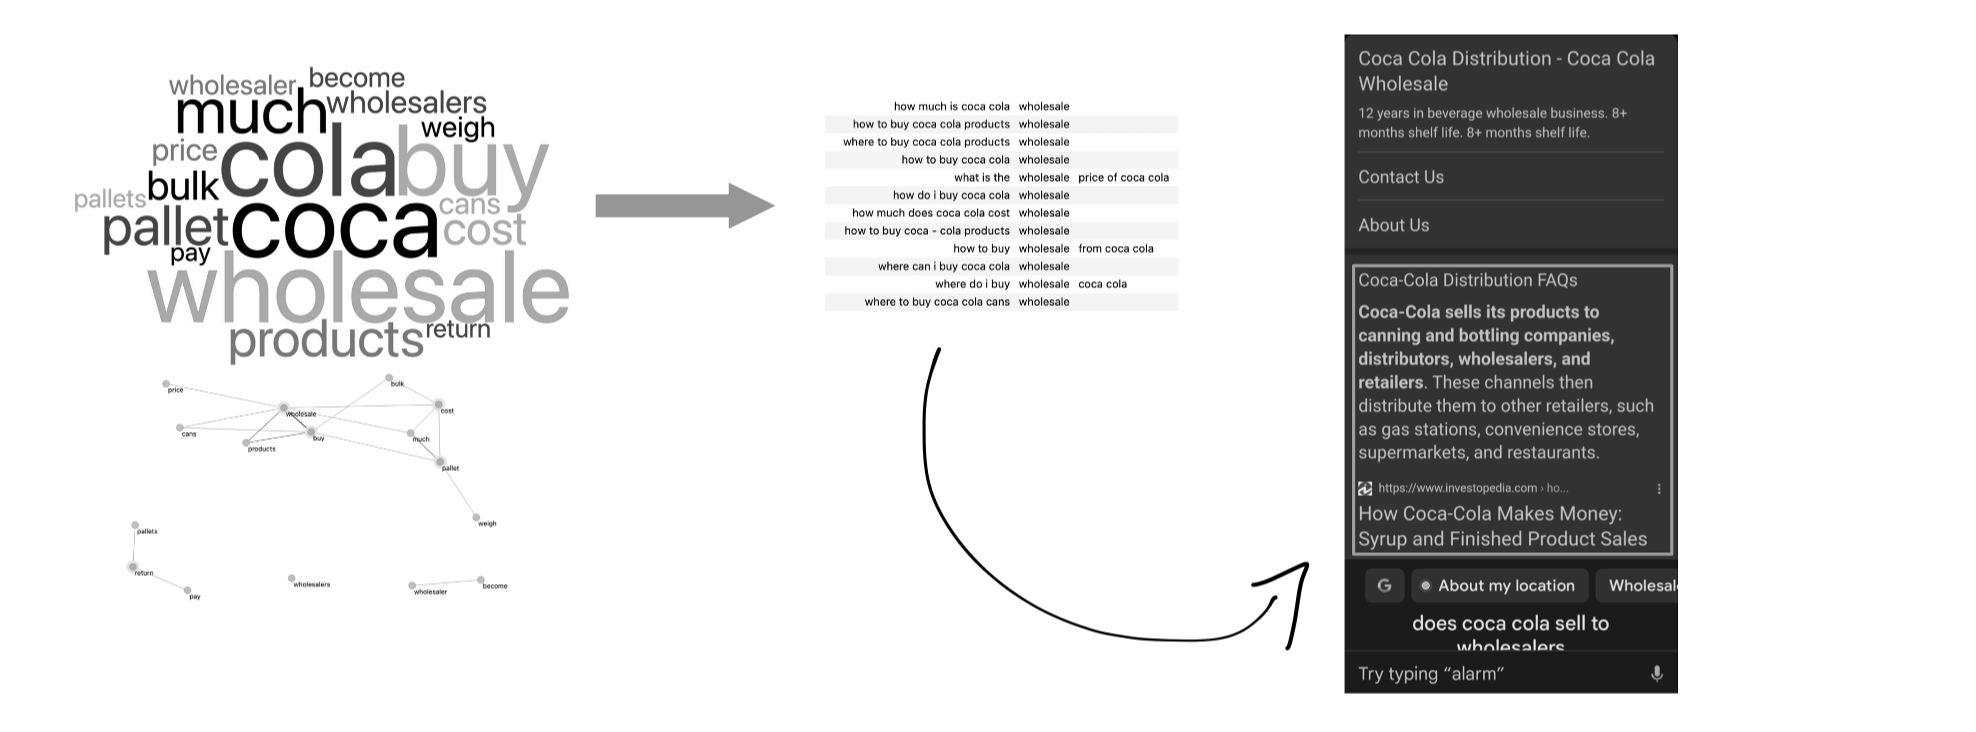
Search Intent Analysis
EXTERNAL RESEARCH ANALYSIS
Currently, external searches related to our products lead to Investopedia: The search intents that lead to our Corporate Portal are not linked to the Customer Portal.
EVENTS ANALYSIS
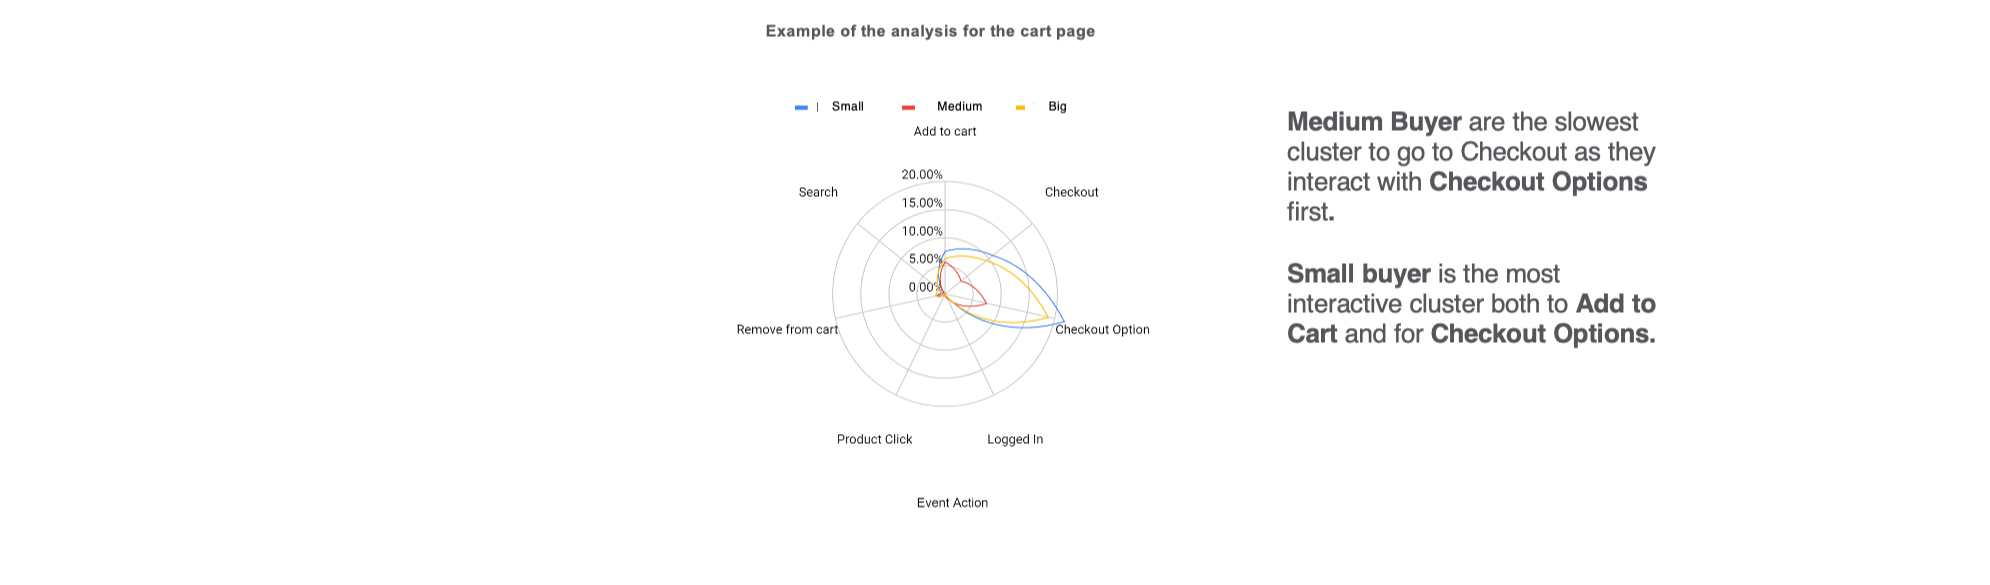
We took into consideration the main events to confirm personal behaviors
Key takeaways: From the analysis, we identified tags that need to be reviewed (e.g., the checkout option).
SEARCH QUERY ANALYSIS
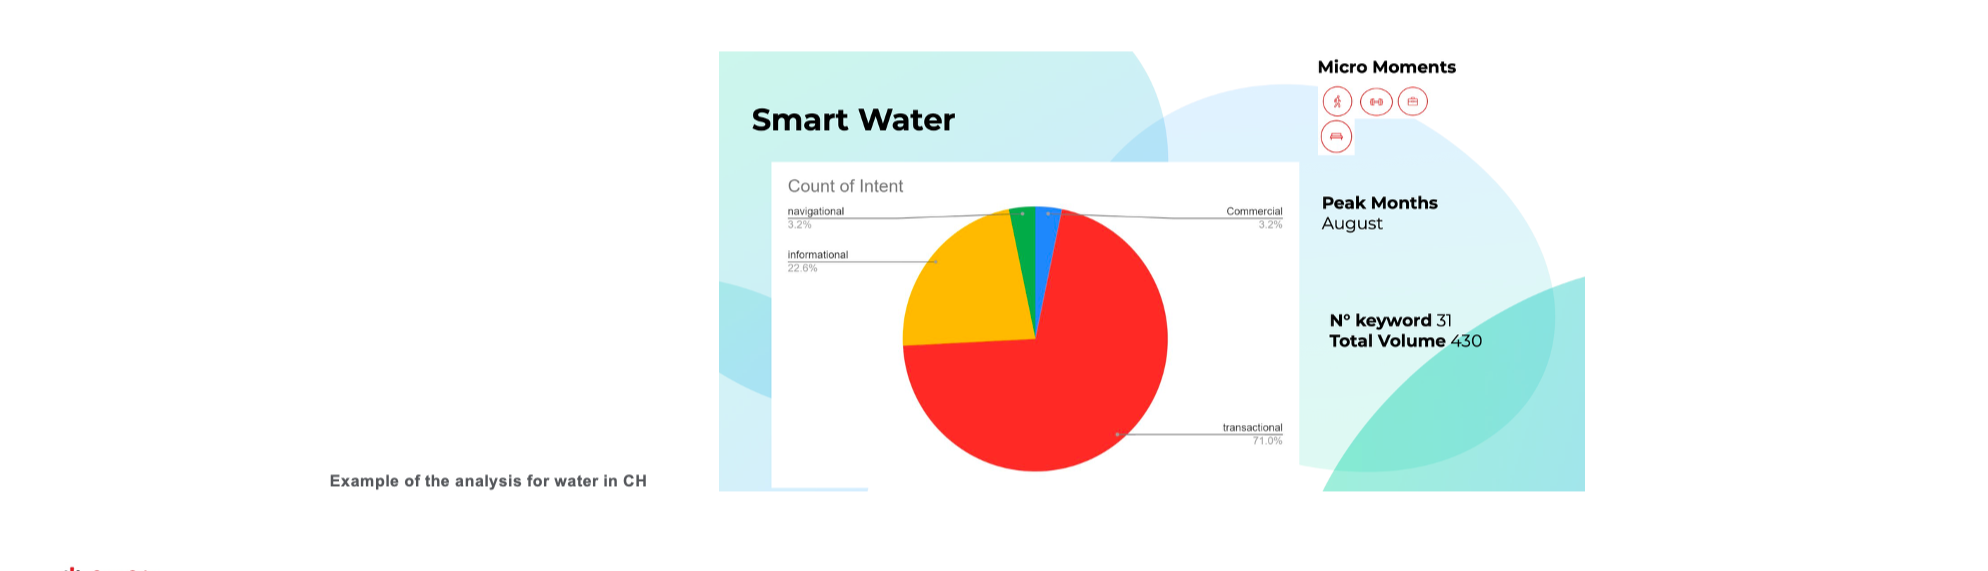
With the support of an AI, we analyze search query and depending on the words used to perform the search we classified in:
Informational - users look for an answer to a specific question or general information
Navigational – search to find a specific site or page
Commercial – search to investigate brands or services
Transactional - users intending to complete an action or purchase
FINAL RECOMMENDATION
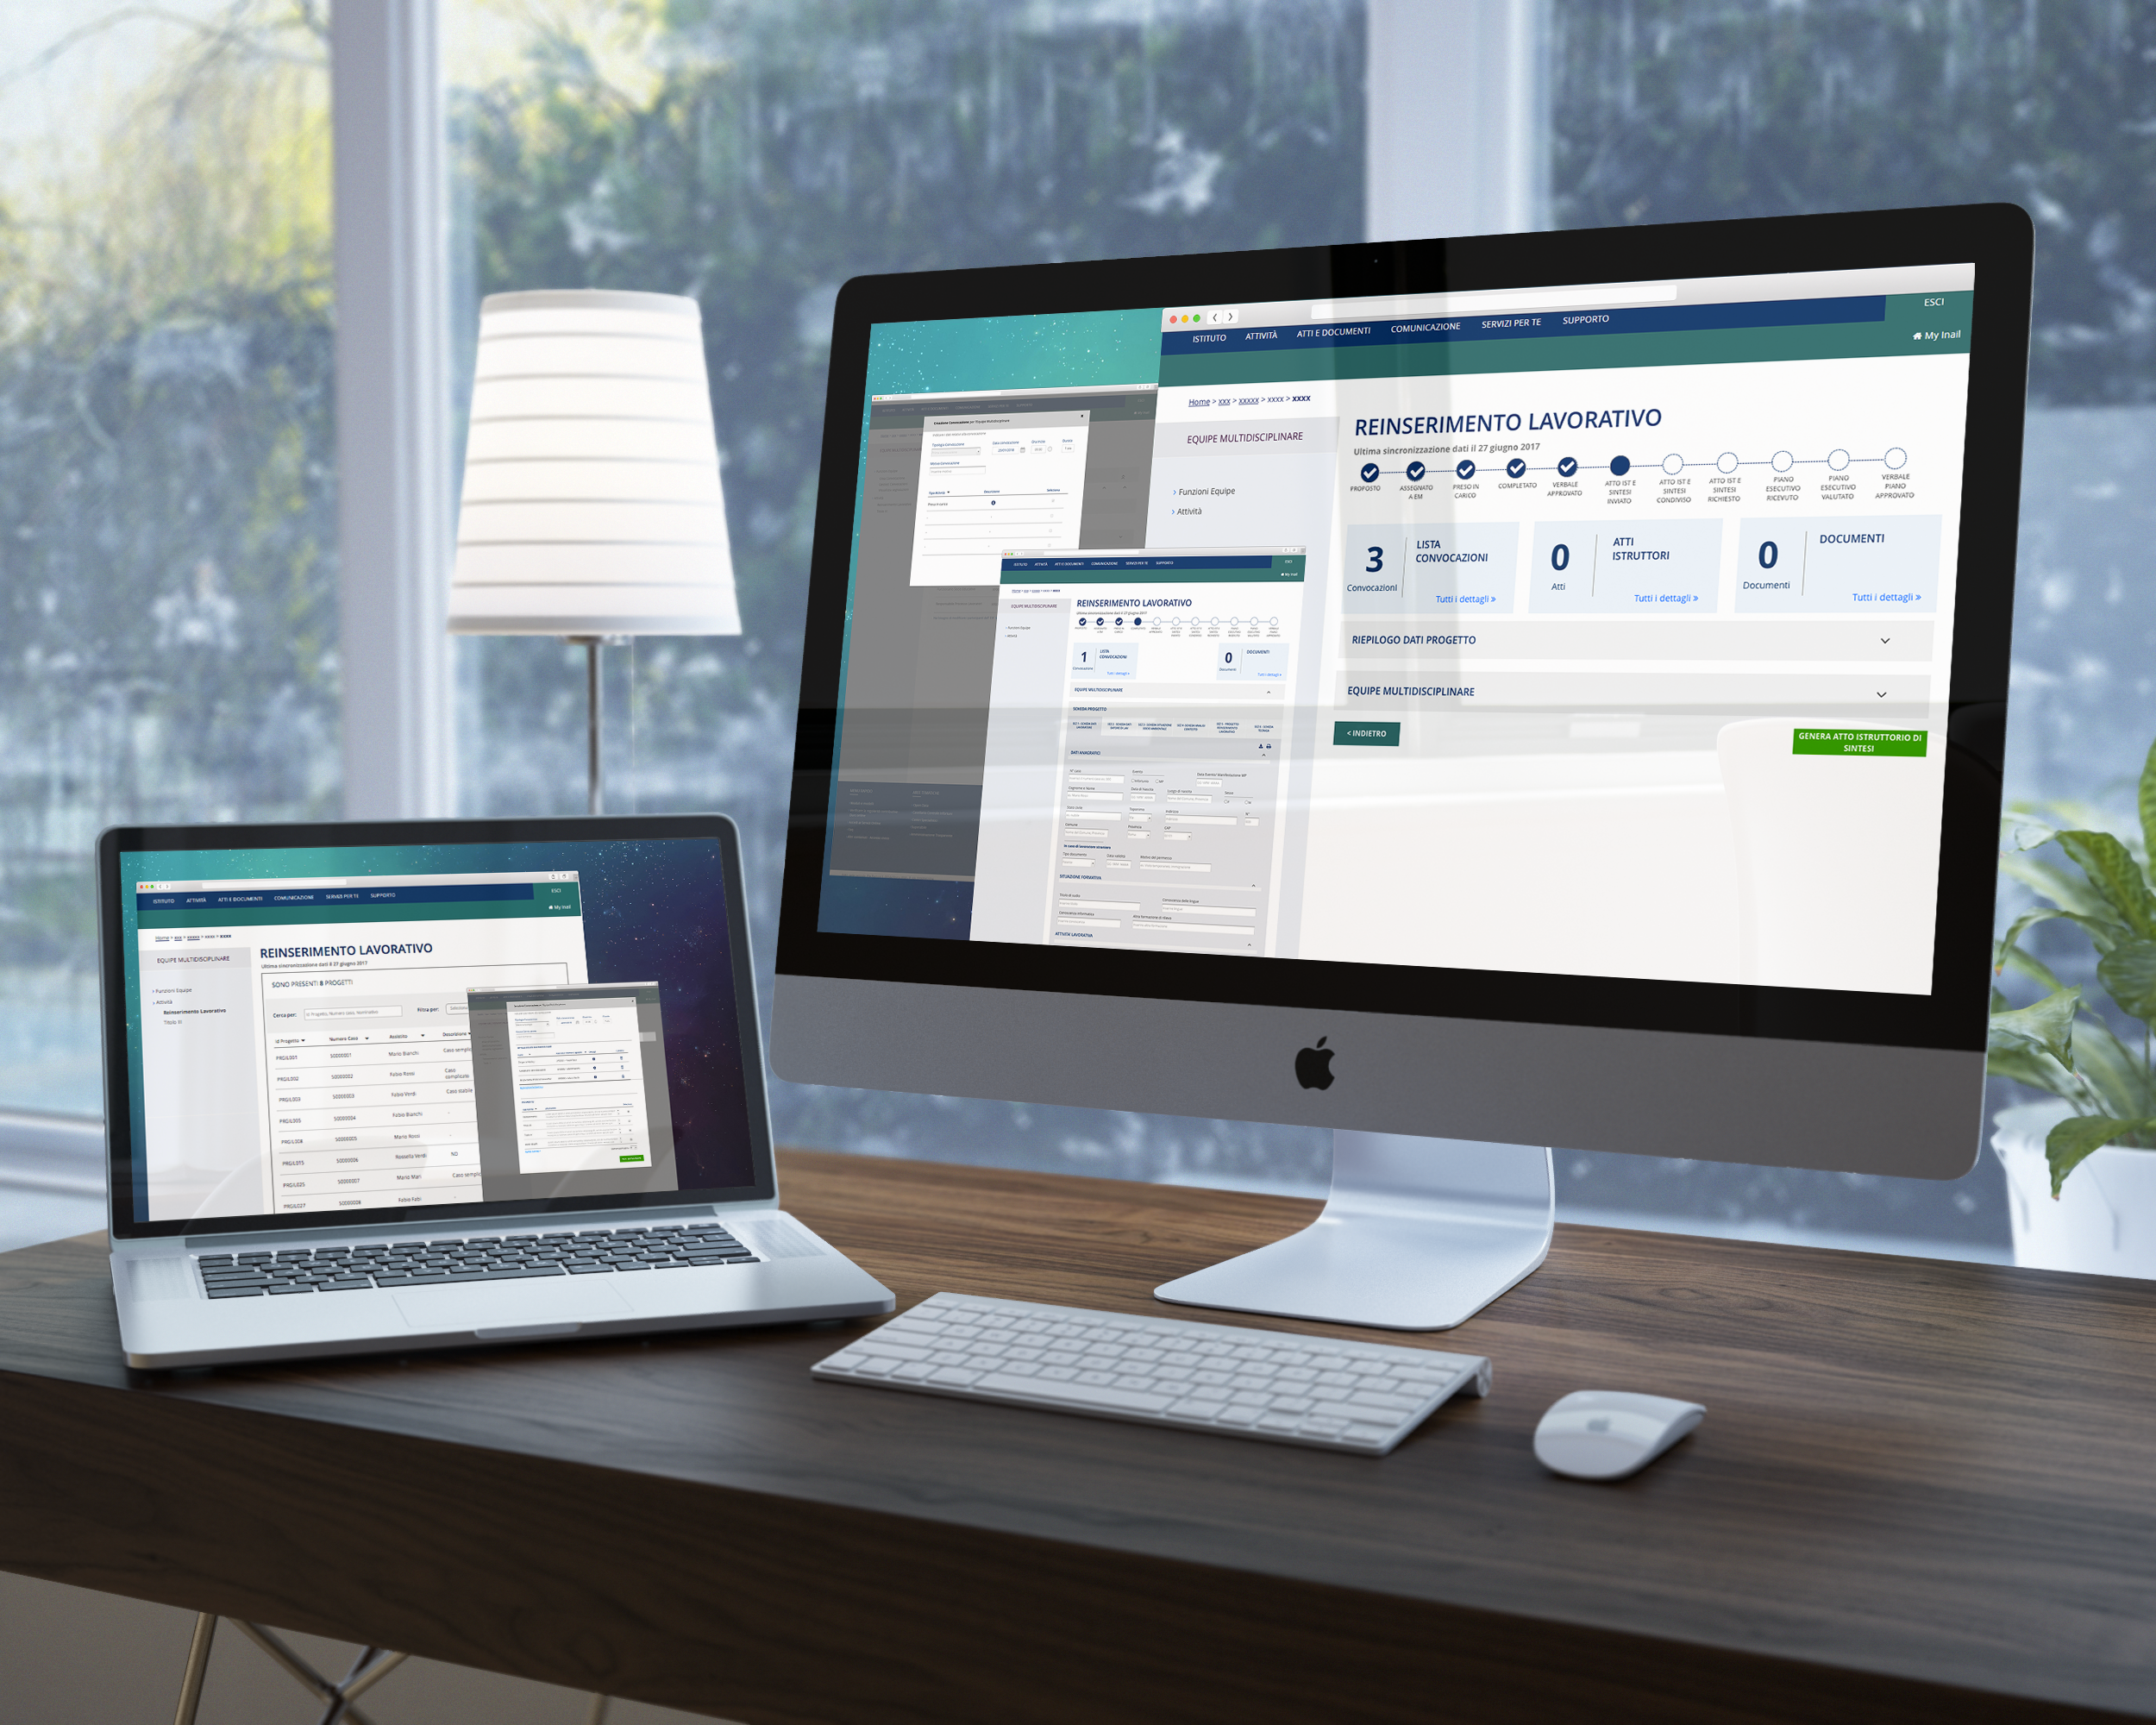
Quantitative KPIs
Custom dashboards were created to monitor key UX and CX metrics across countries, devices, and time periods. These dashboards allowed the team to track improvements over time, compare performance between markets, and validate the impact of new releases.
Customer Journey
Based on the results of interviews and analytics, we mapped the journey stages and identified critical pain points, including:
Flows that block users from completing checkout
Steps that turn the experience into a negative one
Opportunities for improvement across key touchpoints
Identifying Priorities through Pain Score Analysis
Through pain score analysis, we identified and prioritized the most critical areas impacting user experience, defining a clear roadmap for improvement.
These insights directly informed the redesign phase, guiding the optimization of key features and flows to reduce friction and elevate the overall customer journey.
From Research to Redesign
All the research insights — from user interviews and surveys to quantitative data and pain score analysis — formed the foundation for the complete redesign of the Customer Portal.
The outcome was a platform enhanced with new features, improved usability, and a refreshed UI, delivering a smoother and more engaging customer experience.
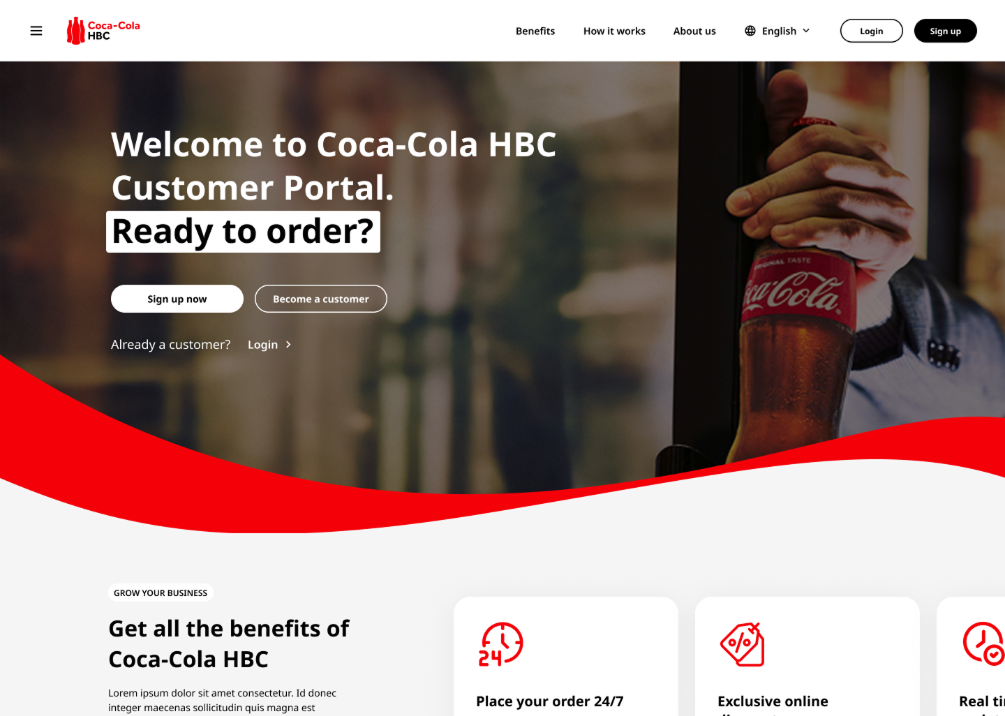
(The images below show the portal before and after the redesign.)

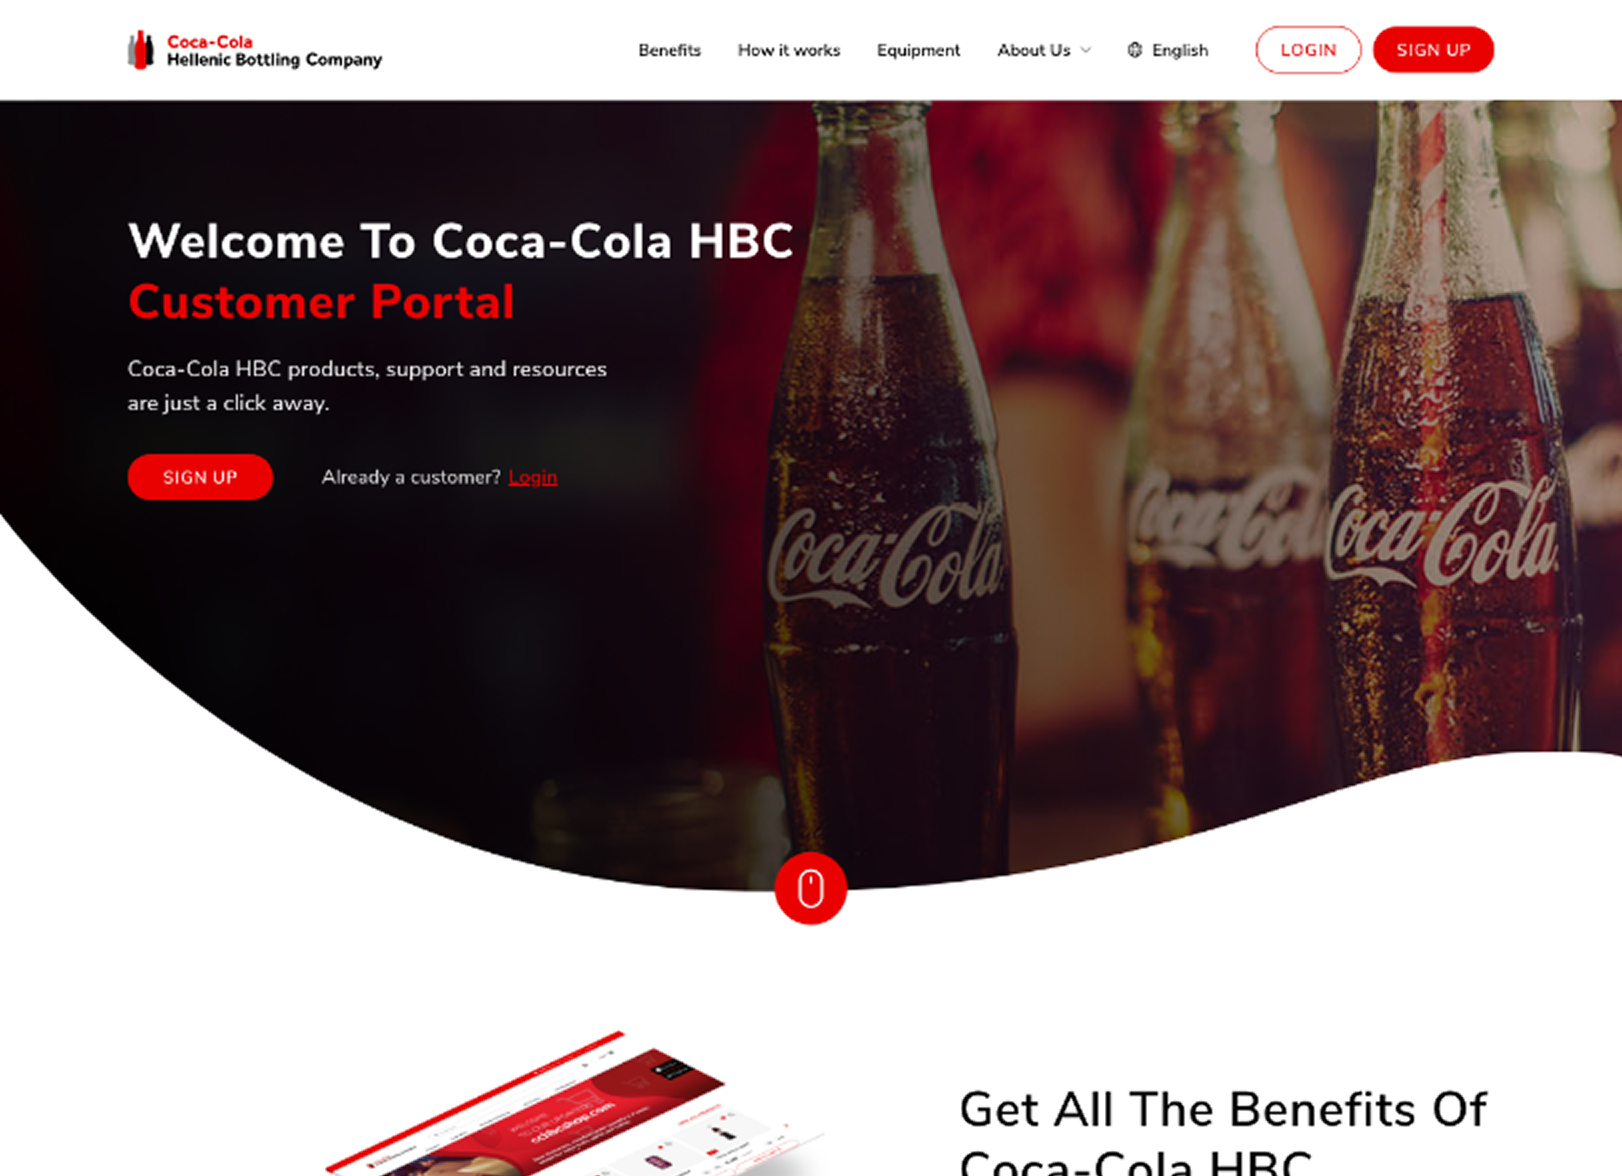
Landing page Old Customer Portal
Landing Page Revamped version
BACK TO WORKS