PROJECT OVERVIEW
PROJECT SCOPE
Client: Public non-profit entity safeguarding workers against physical injuries
Role: UX designer, Product Manager
Project type: Web redesign adhering to company branding standards
Deliverables: User research artifacts, strategy blueprint, sketches, wireframes, interactive prototype
Tools: Photoshop, Axure, Survey Monkey, ppt pen & paper.
Updated 2017
STORY
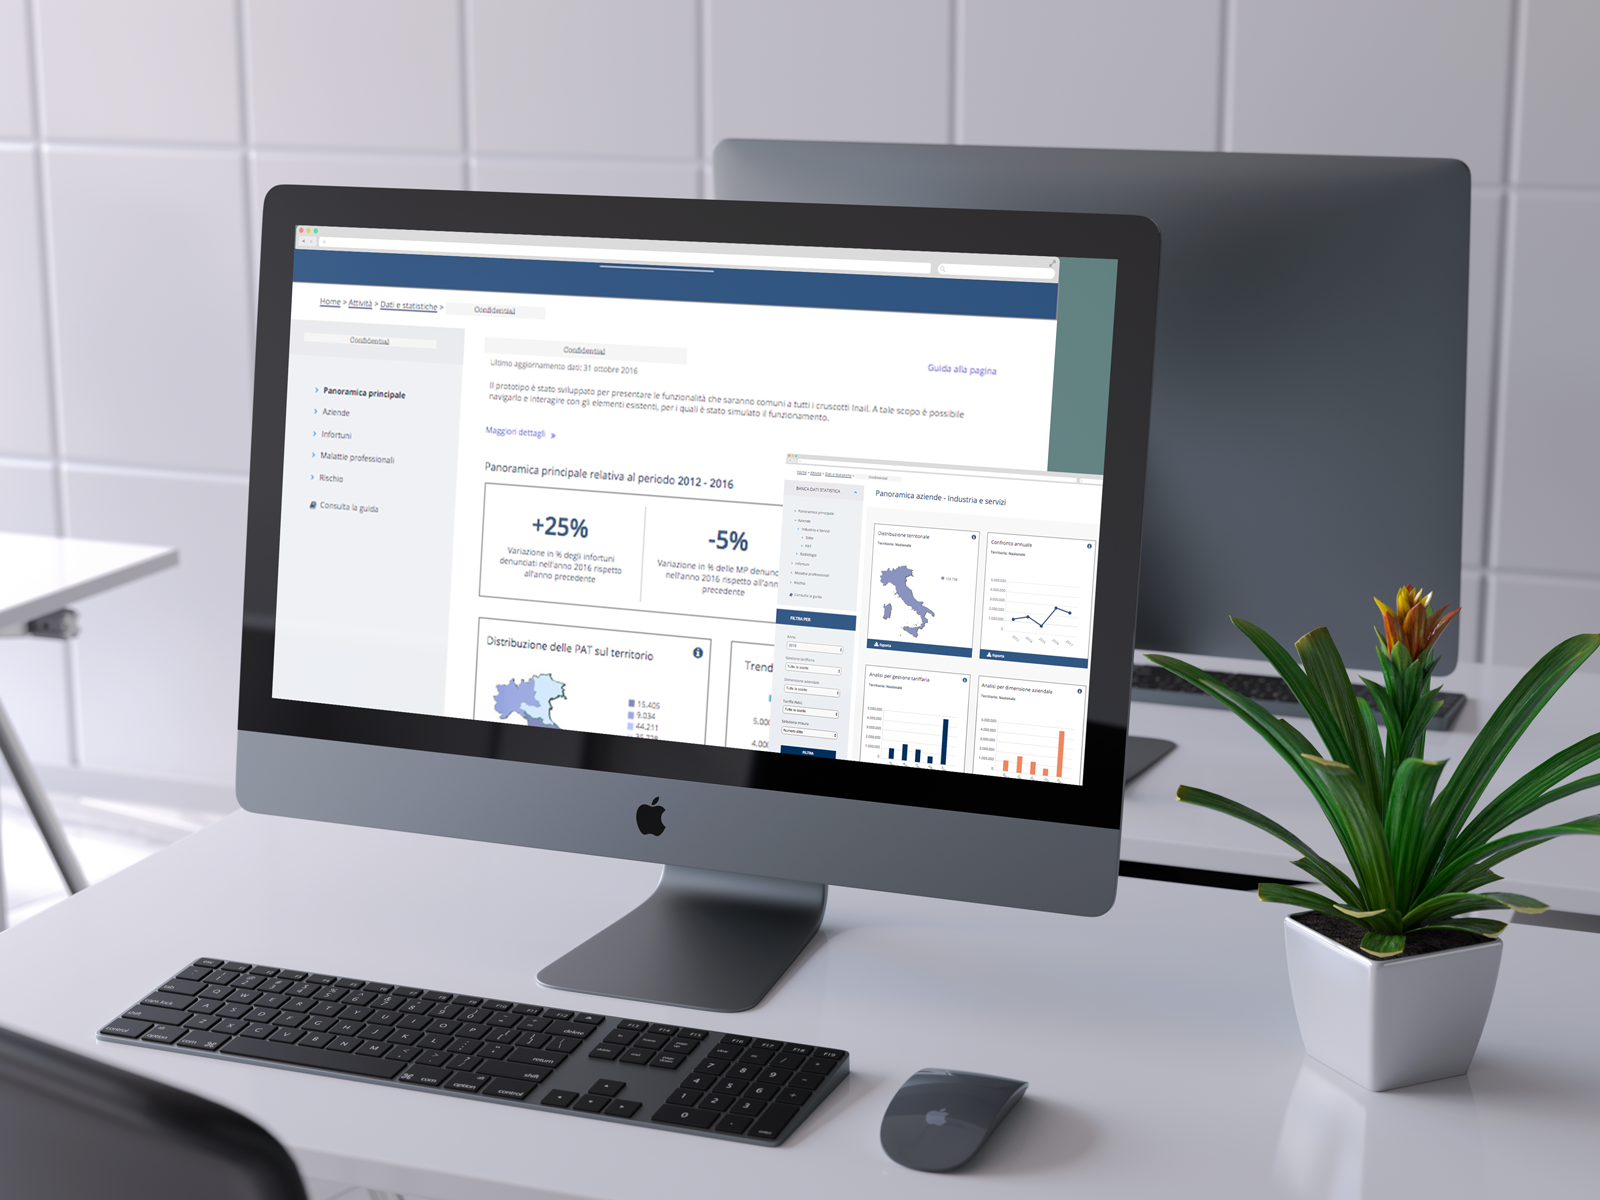
This public entity wishes to revamp one of its online service that provide users with its statistic data.
UX Solution
Through the presentation of data in a pictorial or graphical format the statistics data bank super user streamline their data hunting. With interactive visualization, users can take the concept a step further by using technology to drill down into charts and graphs
OUR APPROACH
We started with assumptions on our user and a low-fi prototype tested with representatives of our personas. And through several quantitative analysis of current solution we got to our dashboard.
ROLE
I was involved in the end-to-end design process:
•Conducted user research to understand user segmentation, goals and behaviors;
•Created wireframes and prototypes to actualize current portal dedicated section, navigation and information architecture schema;
•Redesign a frictionless flow that encourage doctors to complete their work tasks and added digital touch-points features in order to improve user experience
PROCESS

USER RESEARCH & ANALYSIs
Qualitative Analysis
SURVEY


Quantitative Analysis
HEADMAP, RECORDING & TRAFFIC ANALYSIS


KEY TAKE-AWAYS:
The majority of users access directly to the dashboard, that confirms our assumptions about target audience.
Few of them land on the dashboard from other sources or searching on browser ( es. students, researcher)
We identified the most frequently item researched on the old website.
Design
Paper wireframe


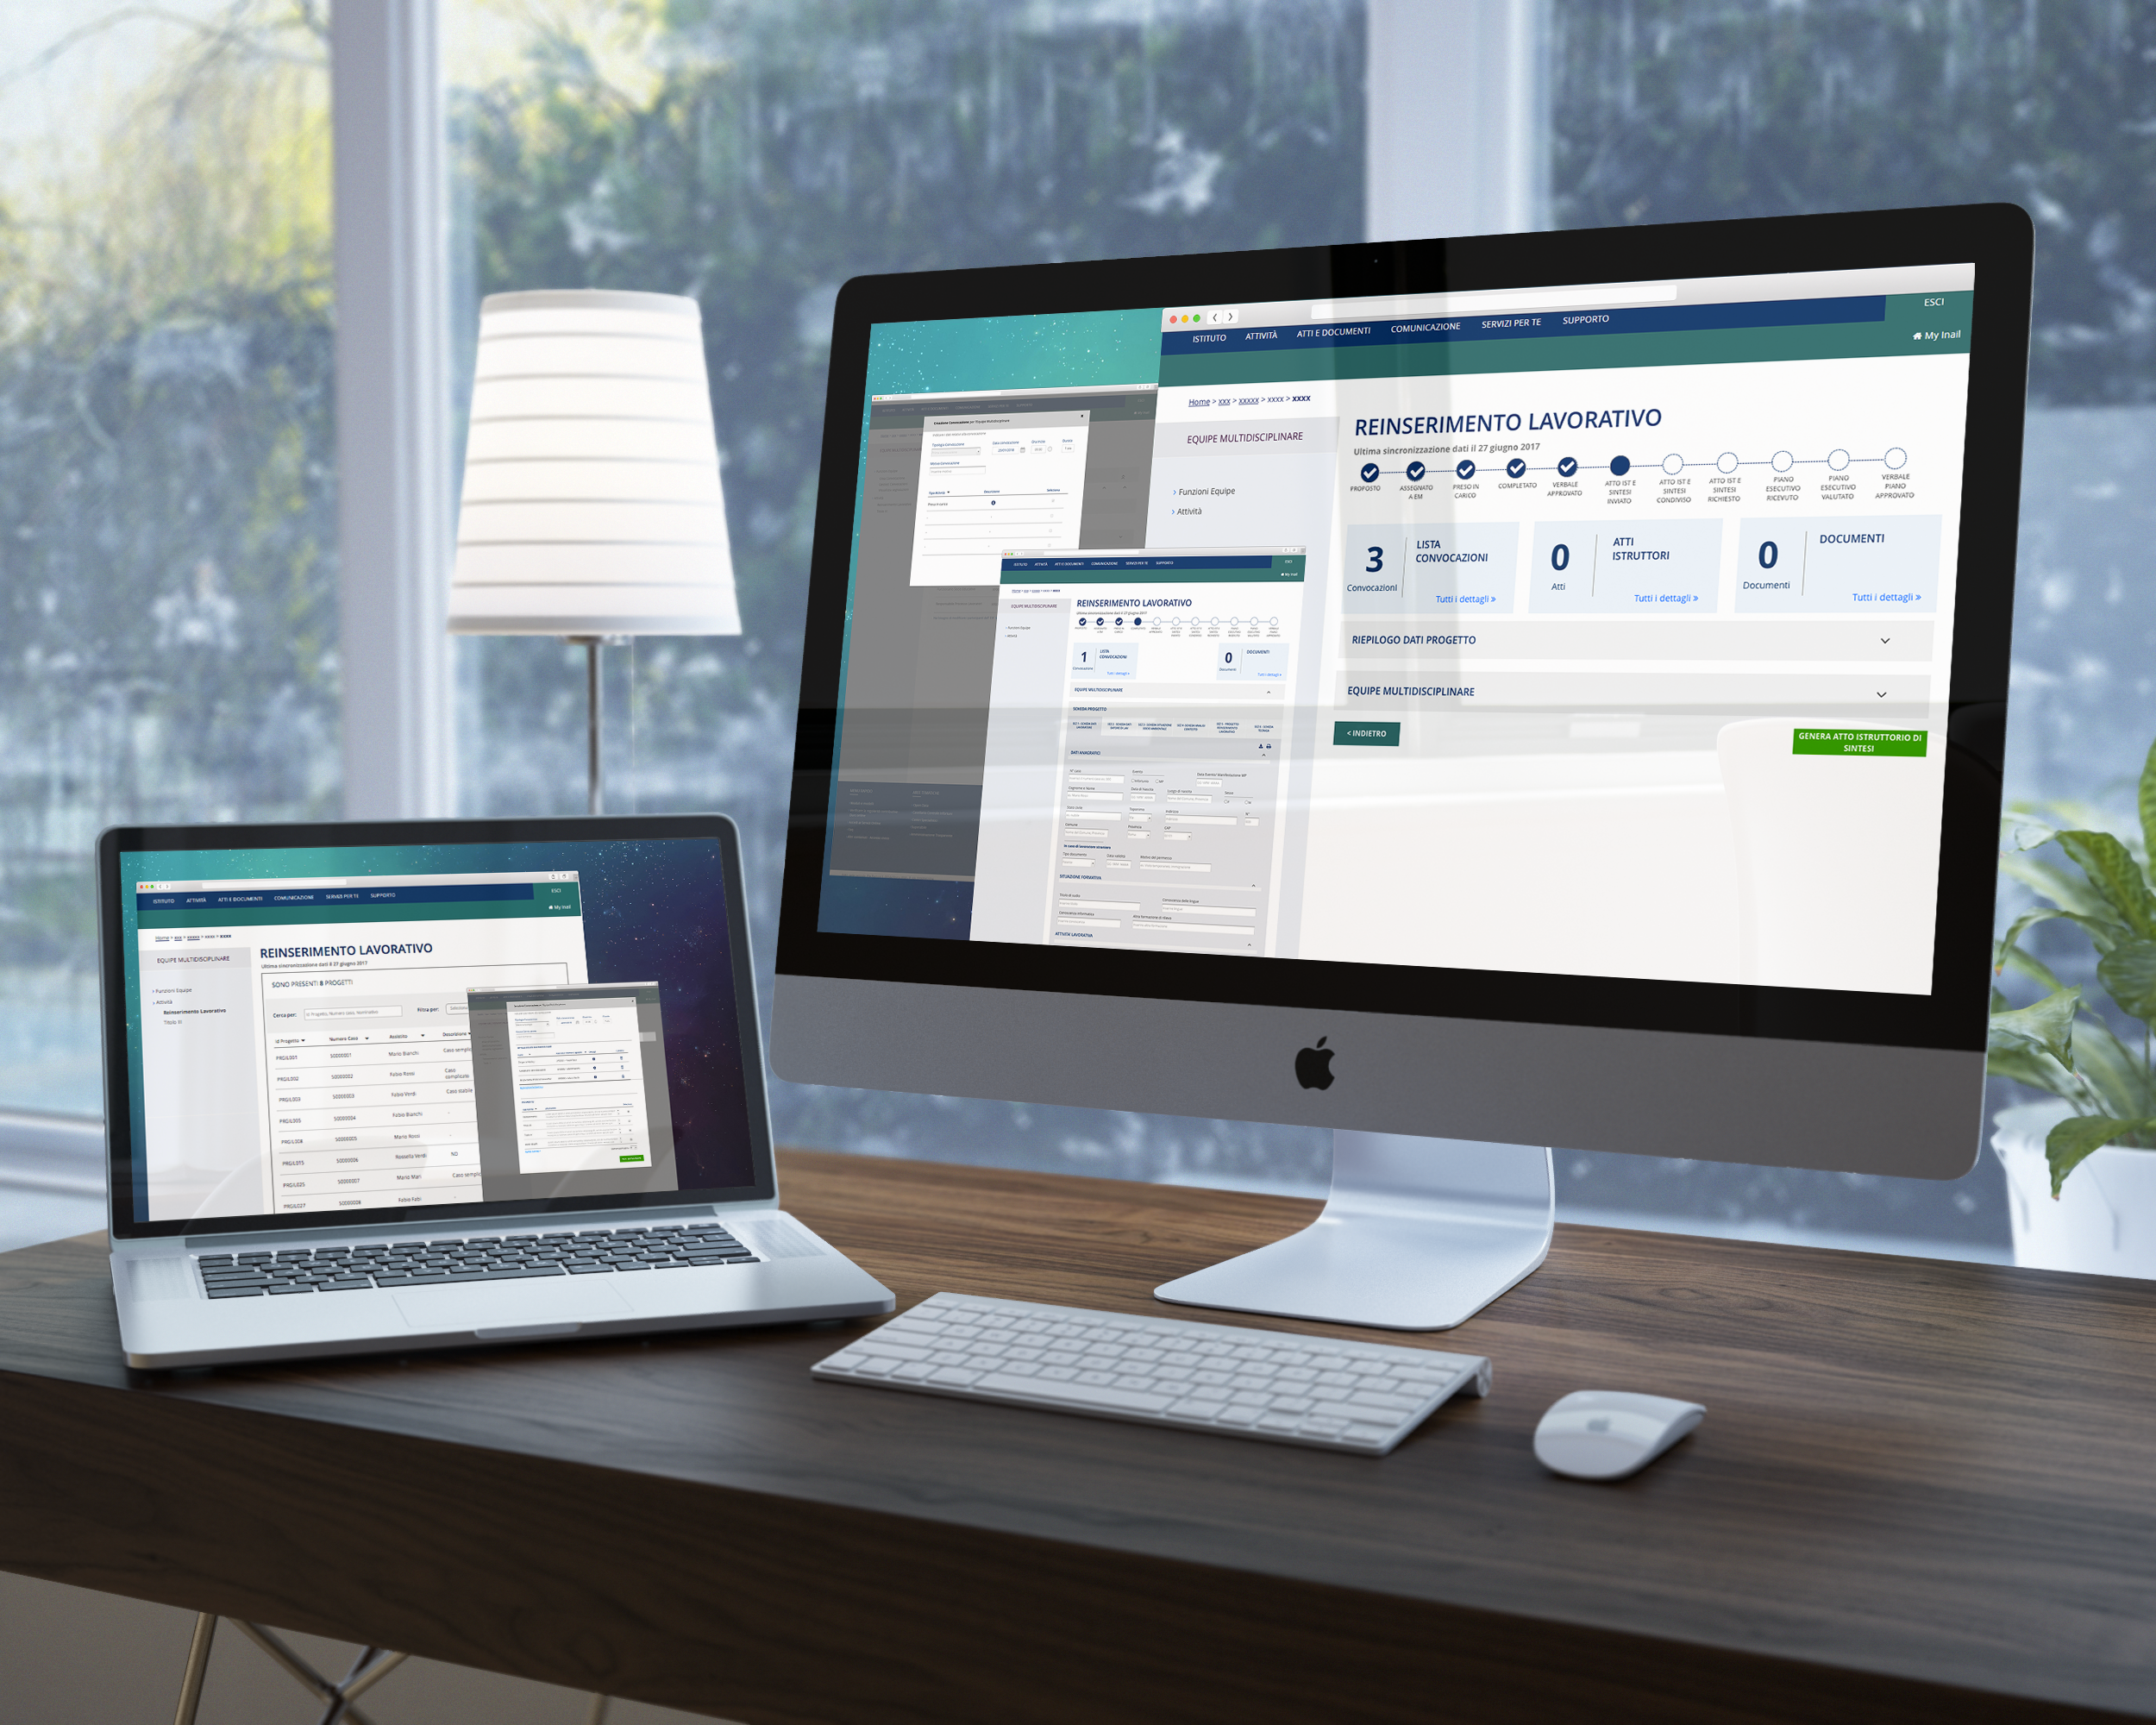
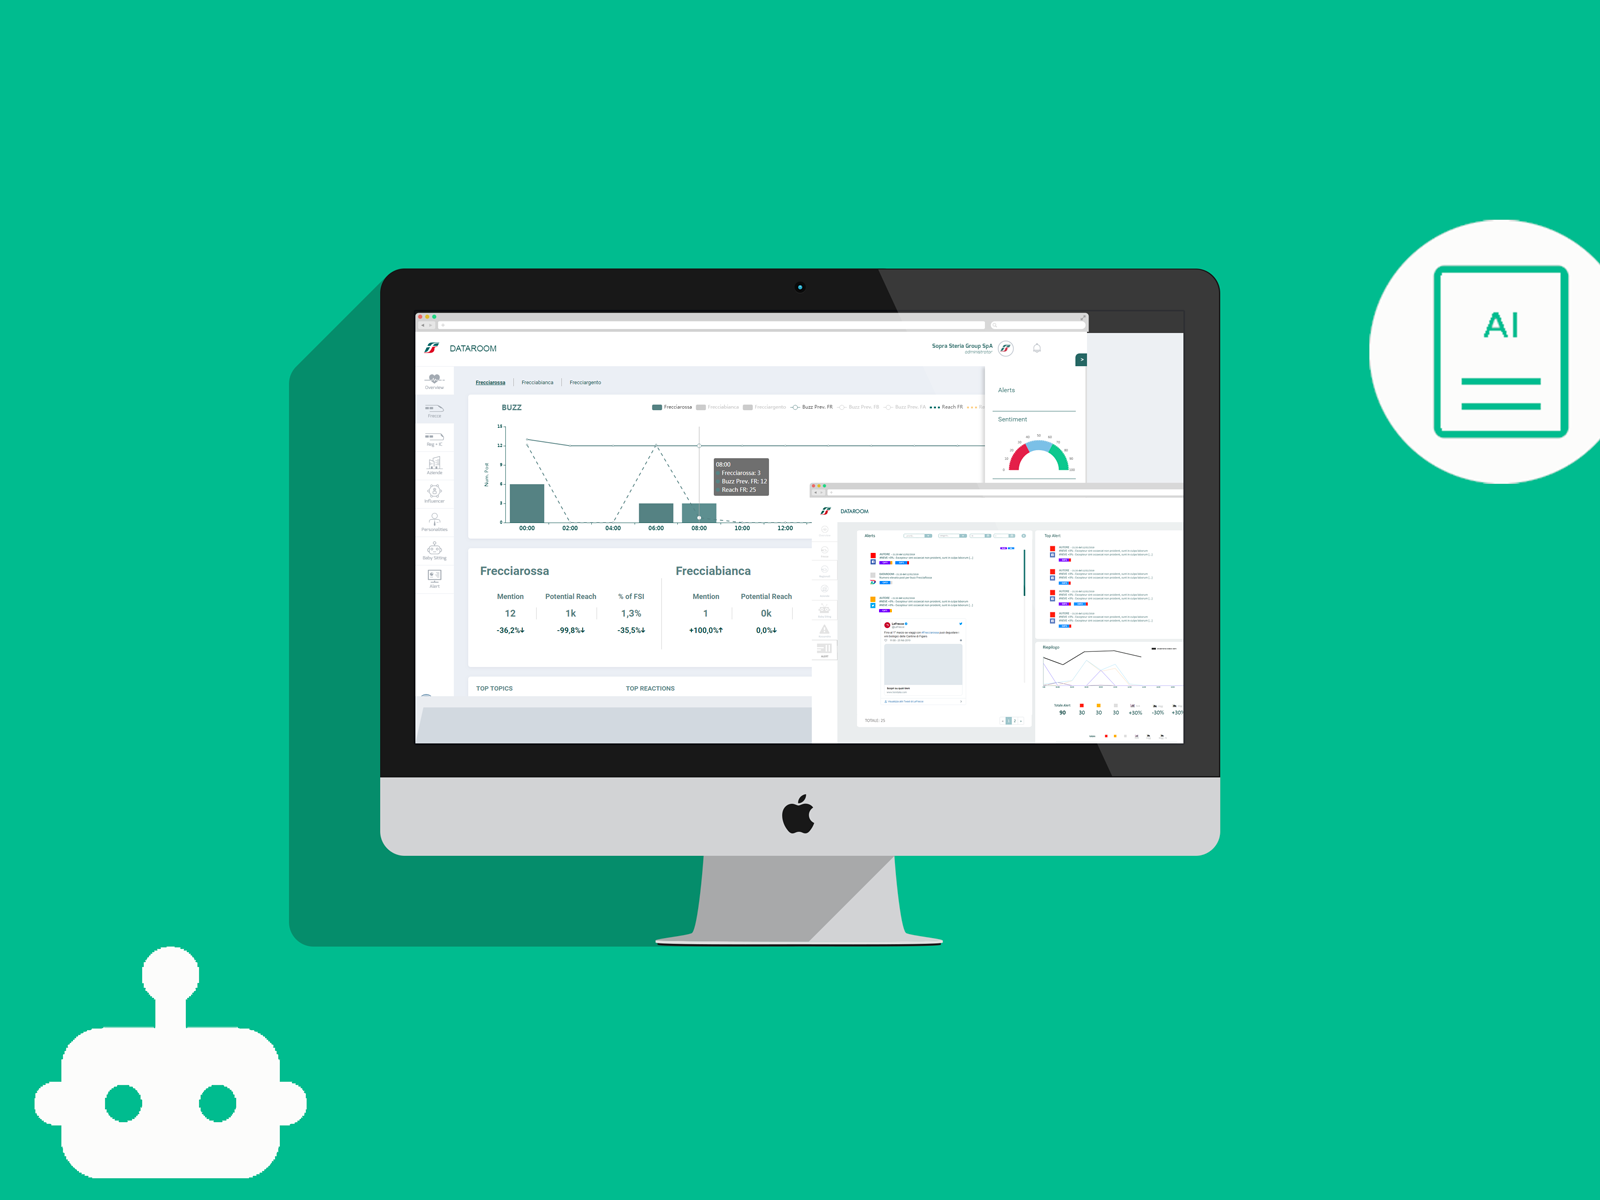
PROTOTYPE
AXURE PROTOTYPE
(Logo covered with confidential label)
Test
CONTEXTUAL VIDEO RECORDING
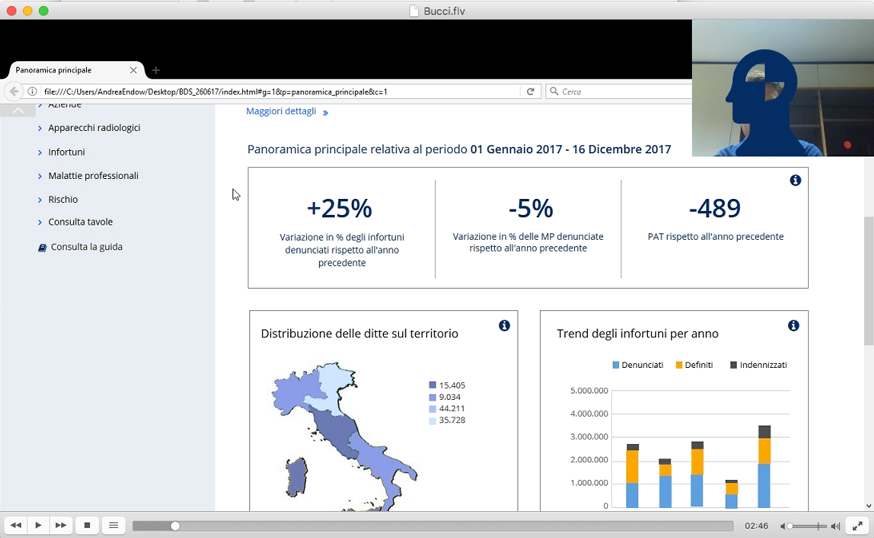


KEY TAKE-AWAYS:
Labels position are very important for user and they should be on top of the charts: This allow them to get a glance an overview
Another very important highlight was that we would have to highlight the time frame for data rapresentation.
ACCESSIBILITY TEST ( STANCA LAW & WCAG)
Different accessibility checklists were used to record the validator assessment either for WCAG or for Stanca's Laws.


BACK TO WORKS